With Bitcoin’s recent price rally, many assume that the bear market is over. But is it too early to call bottoms?
ការវិភាគបច្ចេកទេស
ដោយ: អេឌីស
តារាងប្រចាំថ្ងៃ៖
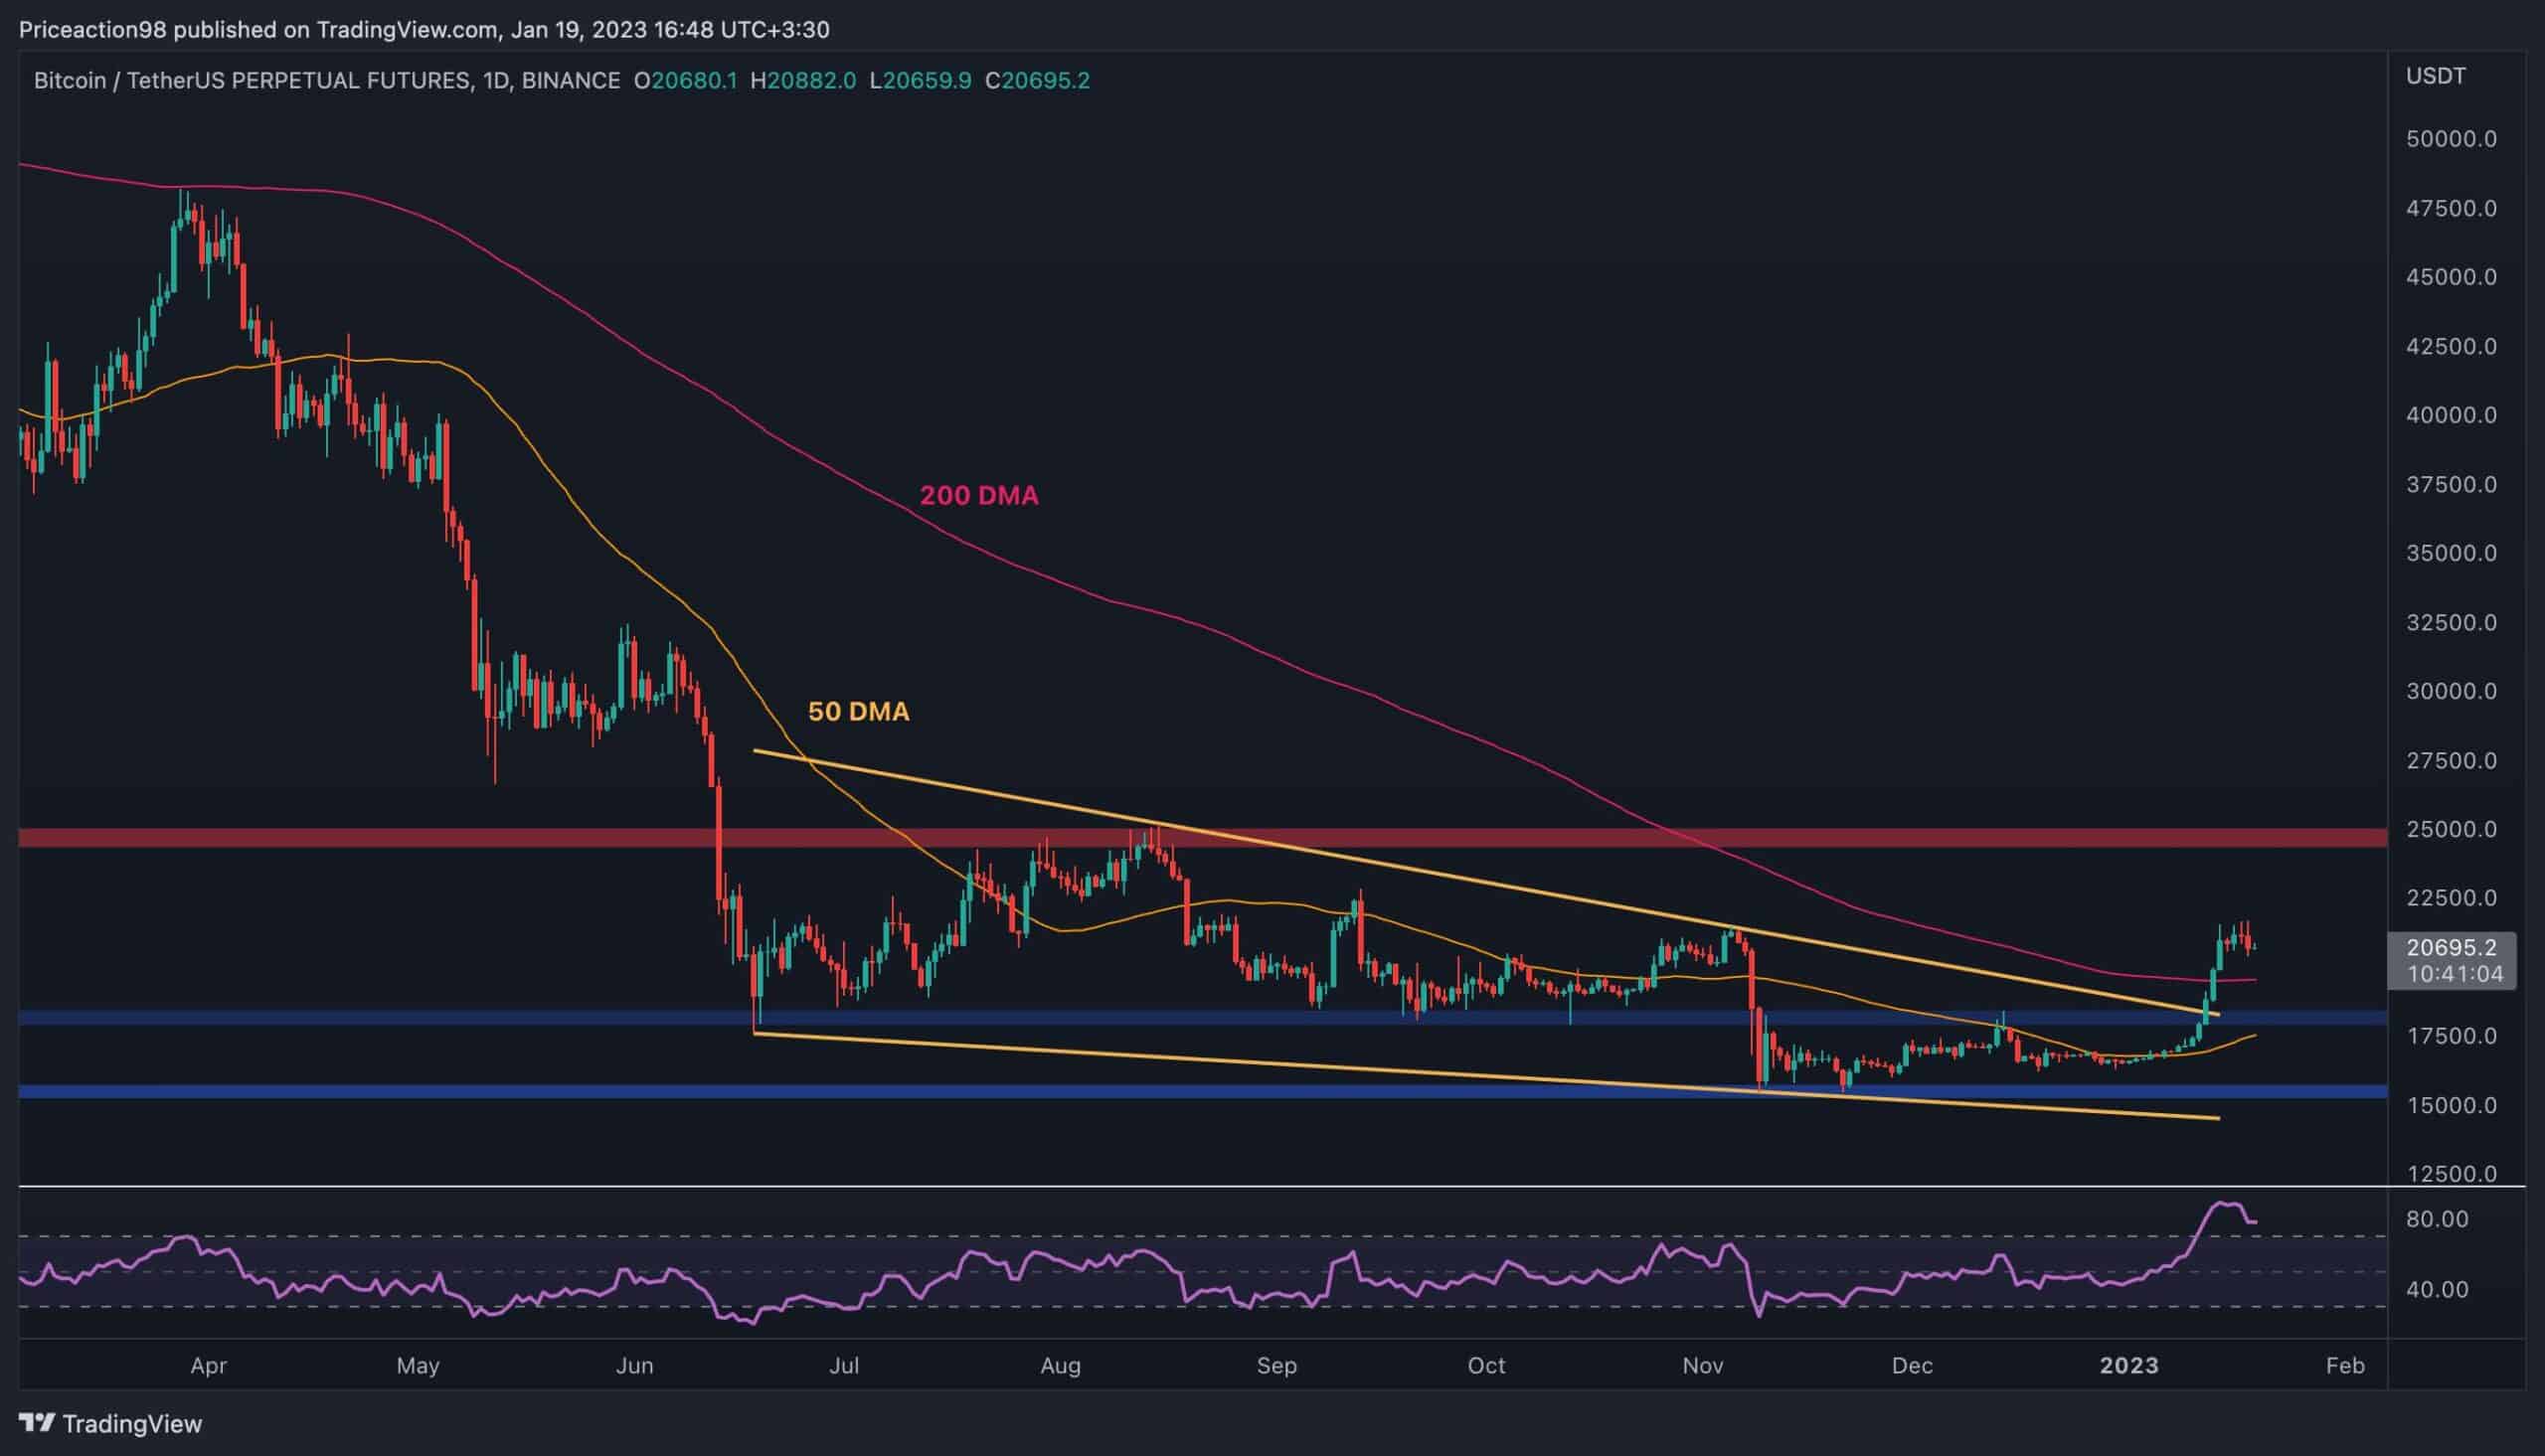
On the daily timeframe, the price has been rallying over the past couple of weeks, breaking above multiple static resistance levels and the significant 200-day moving average. The large falling wedge pattern has also been broken to the upside, which is usually considered a bullish reversal signal.
From a classical price action standpoint, the cryptocurrency seems likely to target the $25K level in the short term.
However, the RSI indicator suggests that BTC is massively overbought, and a bearish pullback or reversal is also highly probable in the short term. In this case, the broken 200-day moving average located around the $19,500 mark and the $18K area could be counted on as potential support levels, which could push the price higher toward the $25K mark.

តារាង 4 ម៉ោង៖
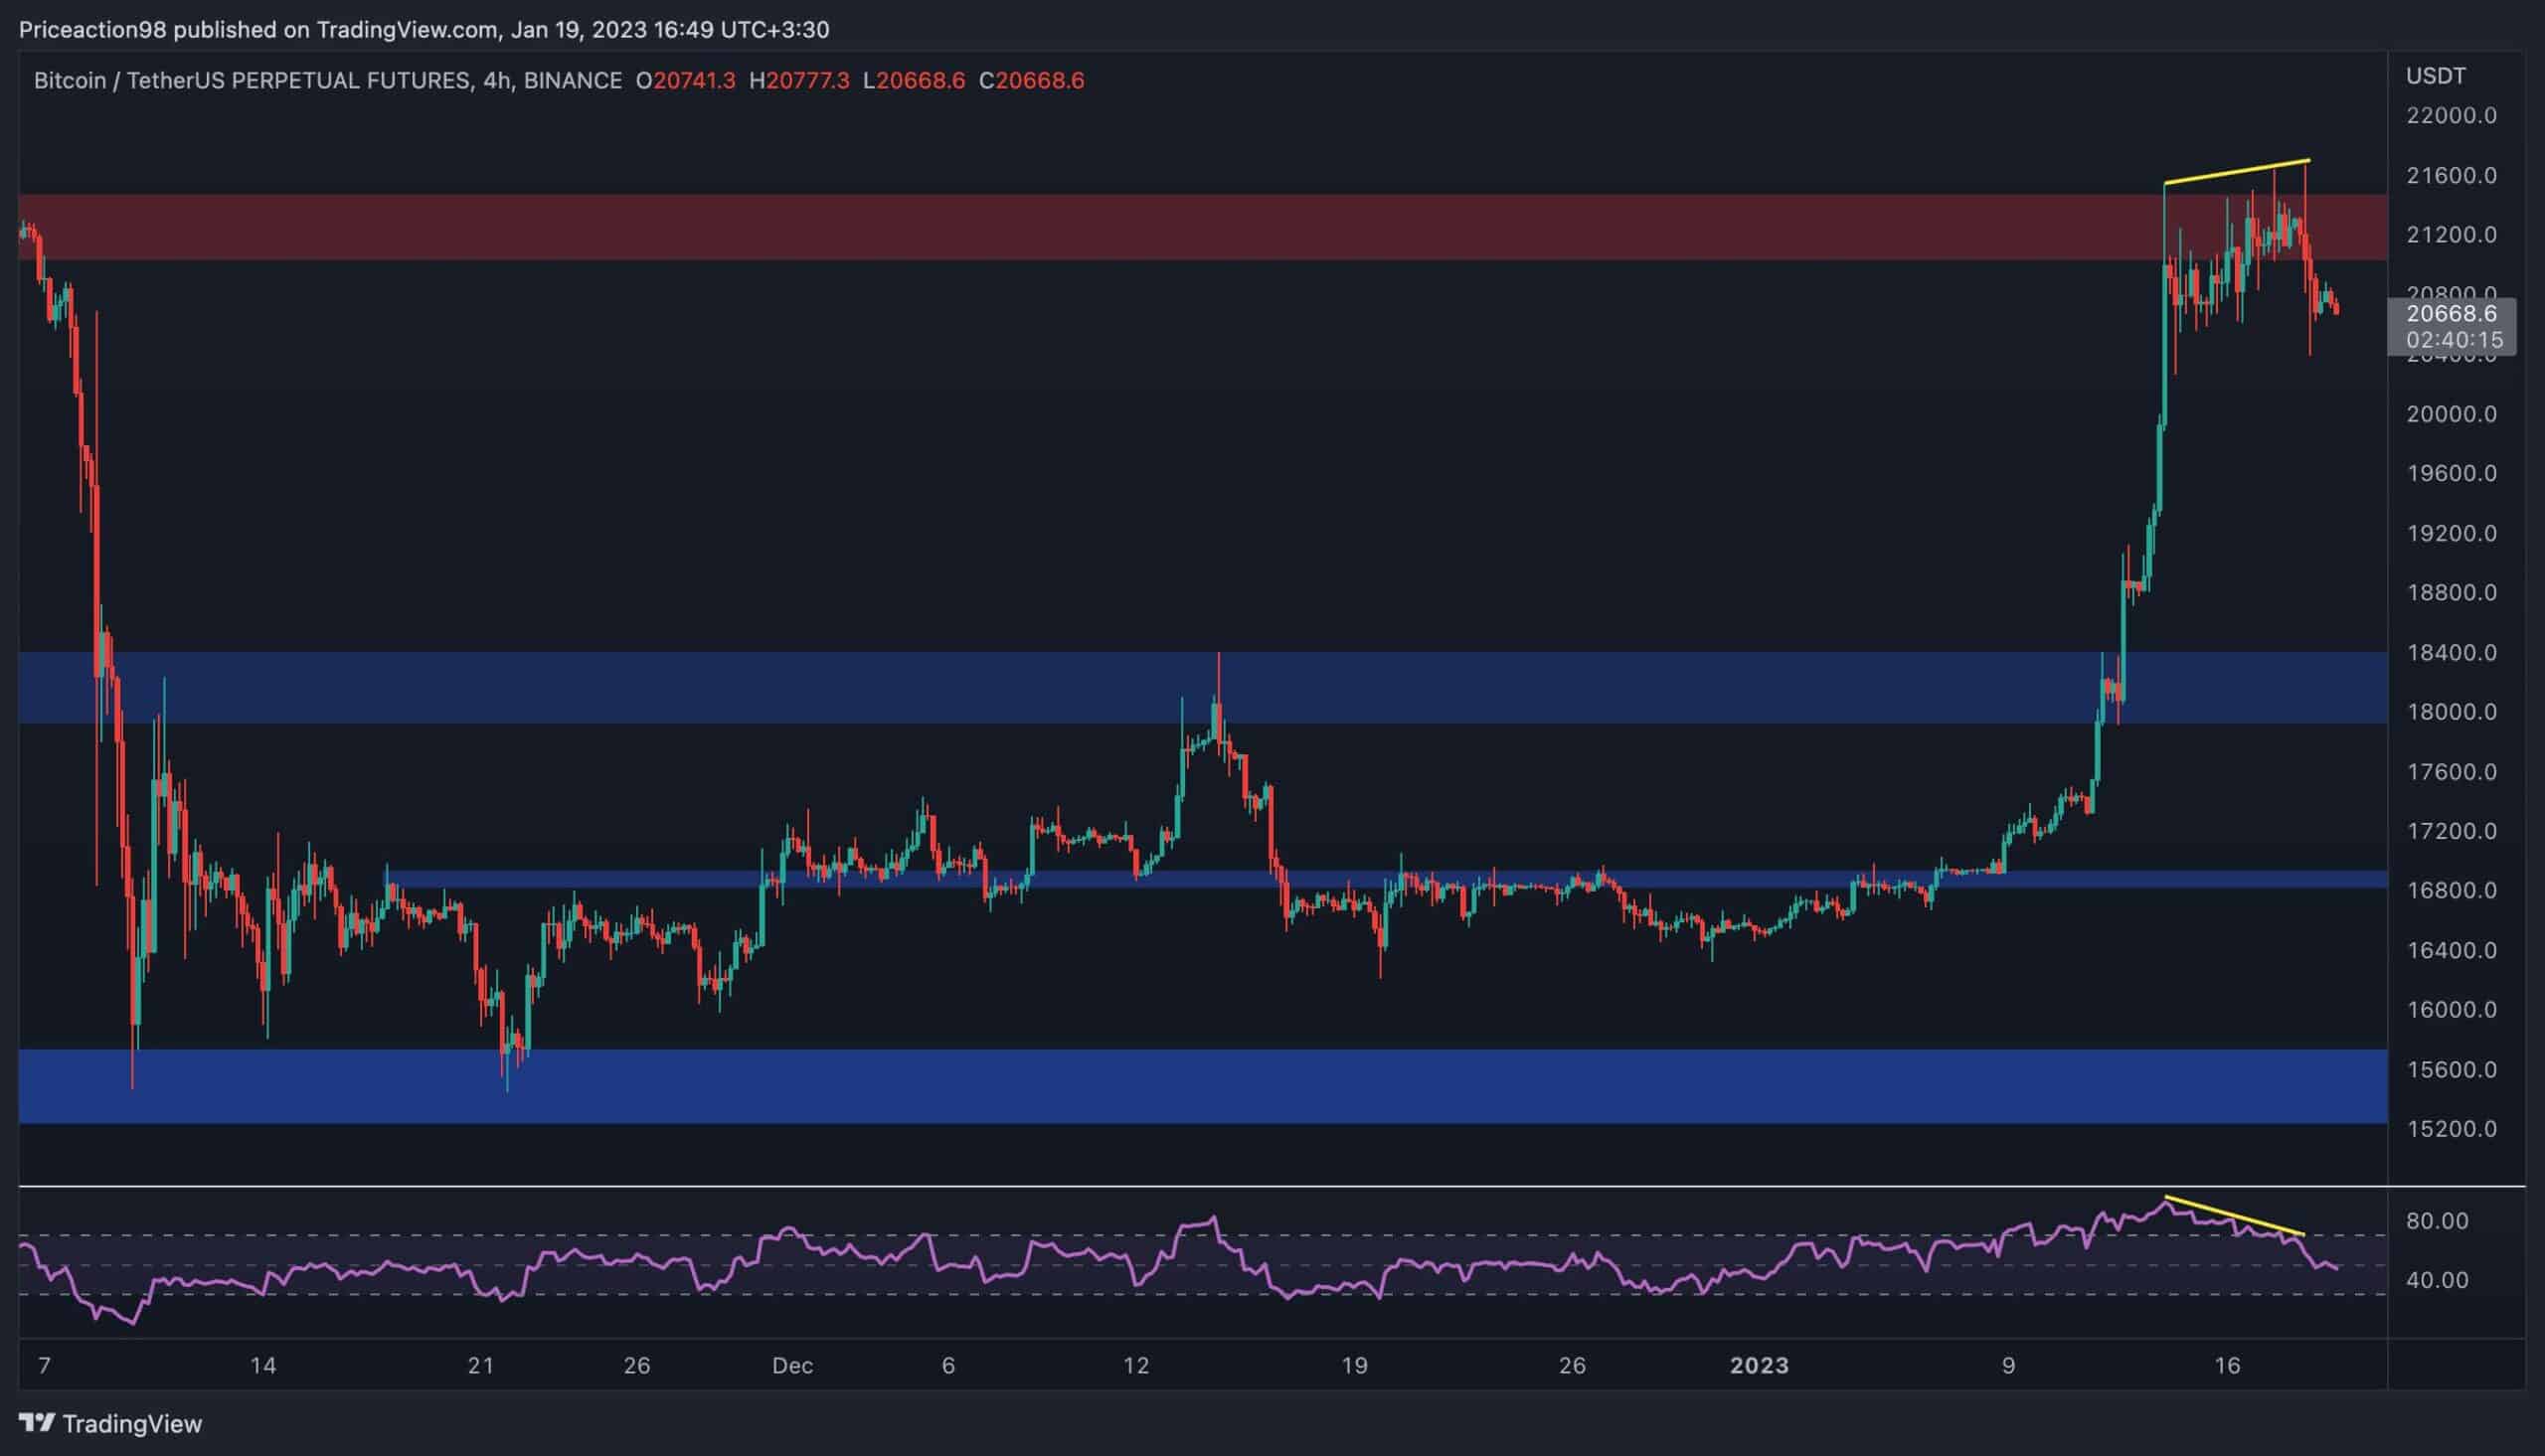
Looking at the 4-hour chart, the price has been rising rapidly and breaking above multiple resistance levels.
However, the $21K area is currently preventing BTC from climbing, and a short-term pullback is seemingly imminent. This takes place following yesterday’s សេចក្តីប្រកាស of the DOJ.
The RSI indicator also shows warning signals in this timeframe, as a clear bearish divergence has been forming between the recent price highs. Therefore, a drop back towards the $18K support area could be expected in the short term, with multiple analysis tools on both the 4-hour and daily timeframes validating this scenario.
ការវិភាគលើសង្វាក់
ដោយ: អេឌីស
Bitcoin Net Unrealized Profit Loss
With the recent surge in Bitcoin’s price, many holders are climbing back above breakeven, and market sentiment is turning positive. The latter usually provides valuable insights for more precise price action prediction, and one of the most useful on-chain metrics for achieving this is the Net Unrealized Profit Loss.
Net Unrealized Profit and Loss (NUPL) is the difference between the market cap and the realized cap divided by the market cap. NUPL indicates the total amount of profit/loss in all the coins represented as a ratio. It could be interpreted as the ratio of investors in profit, with values above 0, meaning more coins are in profit and vice versa.

Recently, the NUPL has increased above 0 due to the price rally after months of negative values, indicating that more investors are in profit now. While this could be interpreted as a bullish signal since fewer market participants are under pressure to sell their coins and prevent further losses, it could also be considered as a warning sign.
Many of these investors may be tempted to exit the market at breakeven or with tiny amounts of profit, and the resulting selling pressure could overflow the market with supply.
Binance ឥតគិតថ្លៃ 100 ដុល្លារ (ផ្តាច់មុខ): ប្រើតំណនេះ ដើម្បីចុះឈ្មោះ និងទទួលបាន $100 ឥតគិតថ្លៃ និងថ្លៃសេវា 10% លើ Binance Futures ខែដំបូង (លក្ខខណ្ឌ).
ការផ្តល់ជូនពិសេសរបស់ PrimeXBT៖ ប្រើតំណនេះ ដើម្បីចុះឈ្មោះ និងបញ្ចូលលេខកូដ POTATO50 ដើម្បីទទួលបានប្រាក់រហូតដល់ 7,000 ដុល្លារលើការដាក់ប្រាក់របស់អ្នក។
ការបដិសេធ: ព័ត៌មានដែលរកឃើញនៅលើគ្រីបតូប៉ូតូតូគឺជាព័ត៌មានរបស់អ្នកនិពន្ធ។ វាមិនតំណាងឱ្យគំនិតរបស់គ្រីបតូប៉ូតូតូថាតើត្រូវទិញលក់ឬកាន់កាប់ការវិនិយោគណាមួយទេ។ អ្នកត្រូវបានណែនាំឱ្យធ្វើការស្រាវជ្រាវដោយខ្លួនឯងមុនពេលធ្វើការសម្រេចចិត្តវិនិយោគណាមួយ។ ប្រើព័ត៌មានដែលបានផ្តល់ជូនតាមហានិភ័យរបស់អ្នក។ សូមមើលការបដិសេធសម្រាប់ព័ត៌មានបន្ថែម។
តារាង Cryptocurrency ដោយ TradingView ។
Source: https://cryptopotato.com/bitcoin-battles-for-21k-following-us-doj-news-volatility-incoming-btc-price-analysis/