A popular crypto analyst is using one particular metric to plot out where Bitcoin (BTC) might be headed on the price charts.
នៅក្នុងវគ្គយុទ្ធសាស្រ្តថ្មី Benjamin Cowen ប្រាប់ his 748,000 YouTube subscribers the 200-day simple moving average (SMA) is an accurate indicator of future BTC prices, citing 2018 chart data as a previous example.
“Everyone has a plan until you get rejected by the 200-day moving average.
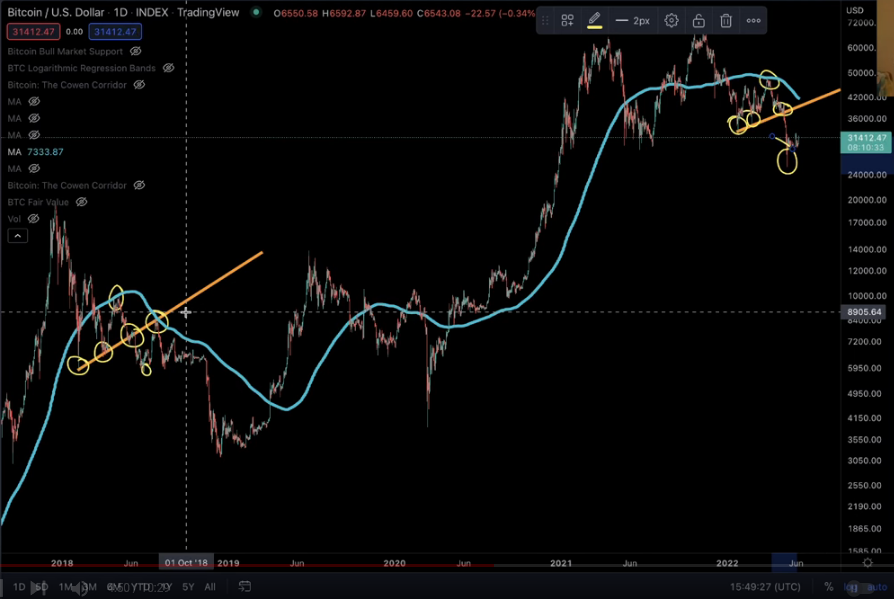
We had the failure to put in a higher low following the rejection of the 200-day moving average. What came after that? A lower low, the same thing that happened back over here in 2018.
What has historically happened after you put in your first lower low is you get a relief rally back to the 200-day moving average, or back to the uptrend line that we were previously holding as support.”
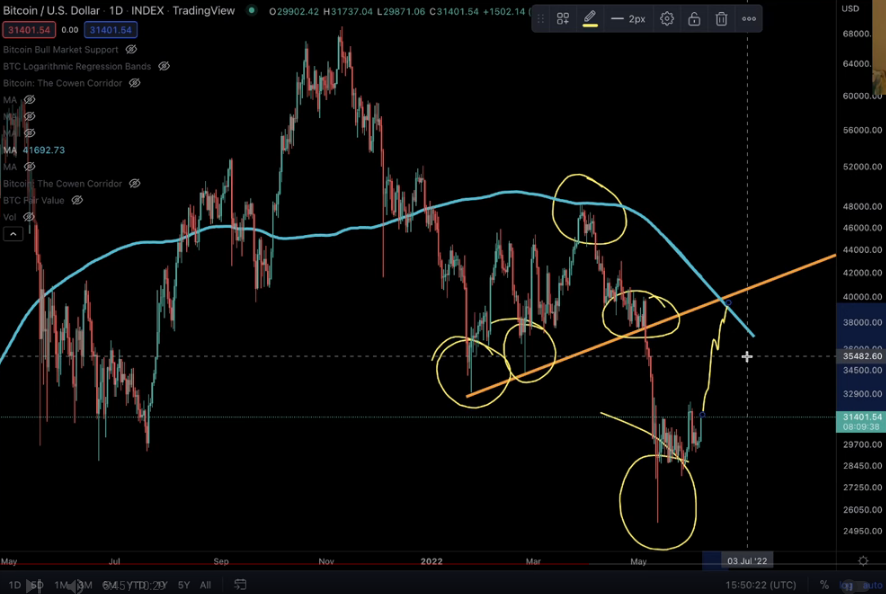
Cowen next points out two potential price points on the SMA, namely $41,700 and $40,000, which he believes are crucial levels for BTC to hold.
“Today the 200-day SMA is coming in at around $41,700 but it is moving down relatively quickly. If we were to dubiously extrapolate this out… you can see that by the middle of June, the 200-day moving average might be close to $40,000.
If we get a relief rally back up you’re going to want to watch that 200-day moving average because that is a line in the sand that we have to get back above.”
The analyst concludes his remarks by saying it can take several attempts for Bitcoin to break out above the 200-day SMA price point, and since BTC is currently in a bear market it’s hard to pinpoint exactly how and when the largest crypto asset by market cap will rally once again.
“One thing to remember, in 2018 we saw continued rejection by the 200-day SMA maybe twice, but you could argue a third time… maybe not really but we almost got to it, and then we ultimately got above it on the fourth real attempt.
Perhaps we’ll have a second one coming in the next several weeks. If that’s the case, then be prepared for the 200-day. I said this back in March, said we’re in a bear market, don’t assume we’re just going to get above the bull market support band and hold it at support just because we did it last time.
The 200-day held as resistance a few months ago could hold as resistance again. We’re not saying that it has to.”
The bull market support band is a technical indicator combining BTC’s 20-week SMA and 21-week exponential moving average (EMA).
នៅពេលសរសេរ Bitcoin has recouped its losses after a sudden drop on June 6th sent it below $30,000.
BTC បច្ចុប្បន្នកំពុងជួញដូរក្នុងតម្លៃ 31,366 ដុល្លារ។
I
ពិនិត្យ សកម្មភាពតម្លៃ
កុំនឹក Beat - ជាវប្រចាំ ដើម្បីទទួលបានការដាស់តឿនអ៊ីមែលតាមអ៊ីមែលដែលផ្ញើដោយផ្ទាល់ទៅប្រអប់ទទួលរបស់អ្នក
តាមយើងនៅលើ Twitter, Facebook និង Telegram
surf ឌឹដហូមលាយប្រចាំថ្ងៃ

ការបដិសេធ: មតិដែលបានសម្តែងនៅឌឹដហូមដស៍មិនមែនជាដំបូន្មានវិនិយោគទេ។ វិនិយោគិនគួរតែប្រឹងប្រែងដោយយកចិត្តទុកដាក់មុនពេលធ្វើការវិនិយោគដែលមានហានិភ័យខ្ពស់នៅក្នុង Bitcoin, cryptocurrency ឬទ្រព្យសម្បត្តិឌីជីថល។ សូមណែនាំថាការផ្ទេរនិងការធ្វើពាណិជ្ជកម្មរបស់អ្នកគឺជាហានិភ័យផ្ទាល់របស់អ្នកហើយការបាត់បង់ណាមួយដែលអ្នកអាចទទួលរងគឺជាទំនួលខុសត្រូវរបស់អ្នក។ Daily Hodl មិនបានផ្តល់អនុសាសន៍ឱ្យទិញឬលក់រូបិយប័ណ្ណគ្រីបថលឬទ្រព្យសម្បត្តិឌីជីថលទេហើយក៏មិនមែនជាអ្នកផ្តល់ប្រឹក្សាផ្នែកវិនិយោគផងដែរ។ សូមកត់សម្គាល់ថាឌឹដេវហូដចូលរួមក្នុងទីផ្សារសម្ព័ន្ធ។
Featured Image: Shutterstock/Natalia Siiatovskaia/Joy Chakma
Source: https://dailyhodl.com/2022/06/08/bitcoin-btc-could-rally-significantly-from-here-says-analyst-benjamin-cowen-but-theres-a-catch/