Bitcoin has fallen far below the $30K support zone after almost a month of tight consolidation. The price has formed a bearish flag with a valid breakout from 2 days ago. Now, a new impulsive leg to the downside is taking place.
ការវិភាគបច្ចេកទេស
ដោយ: អេឌីស
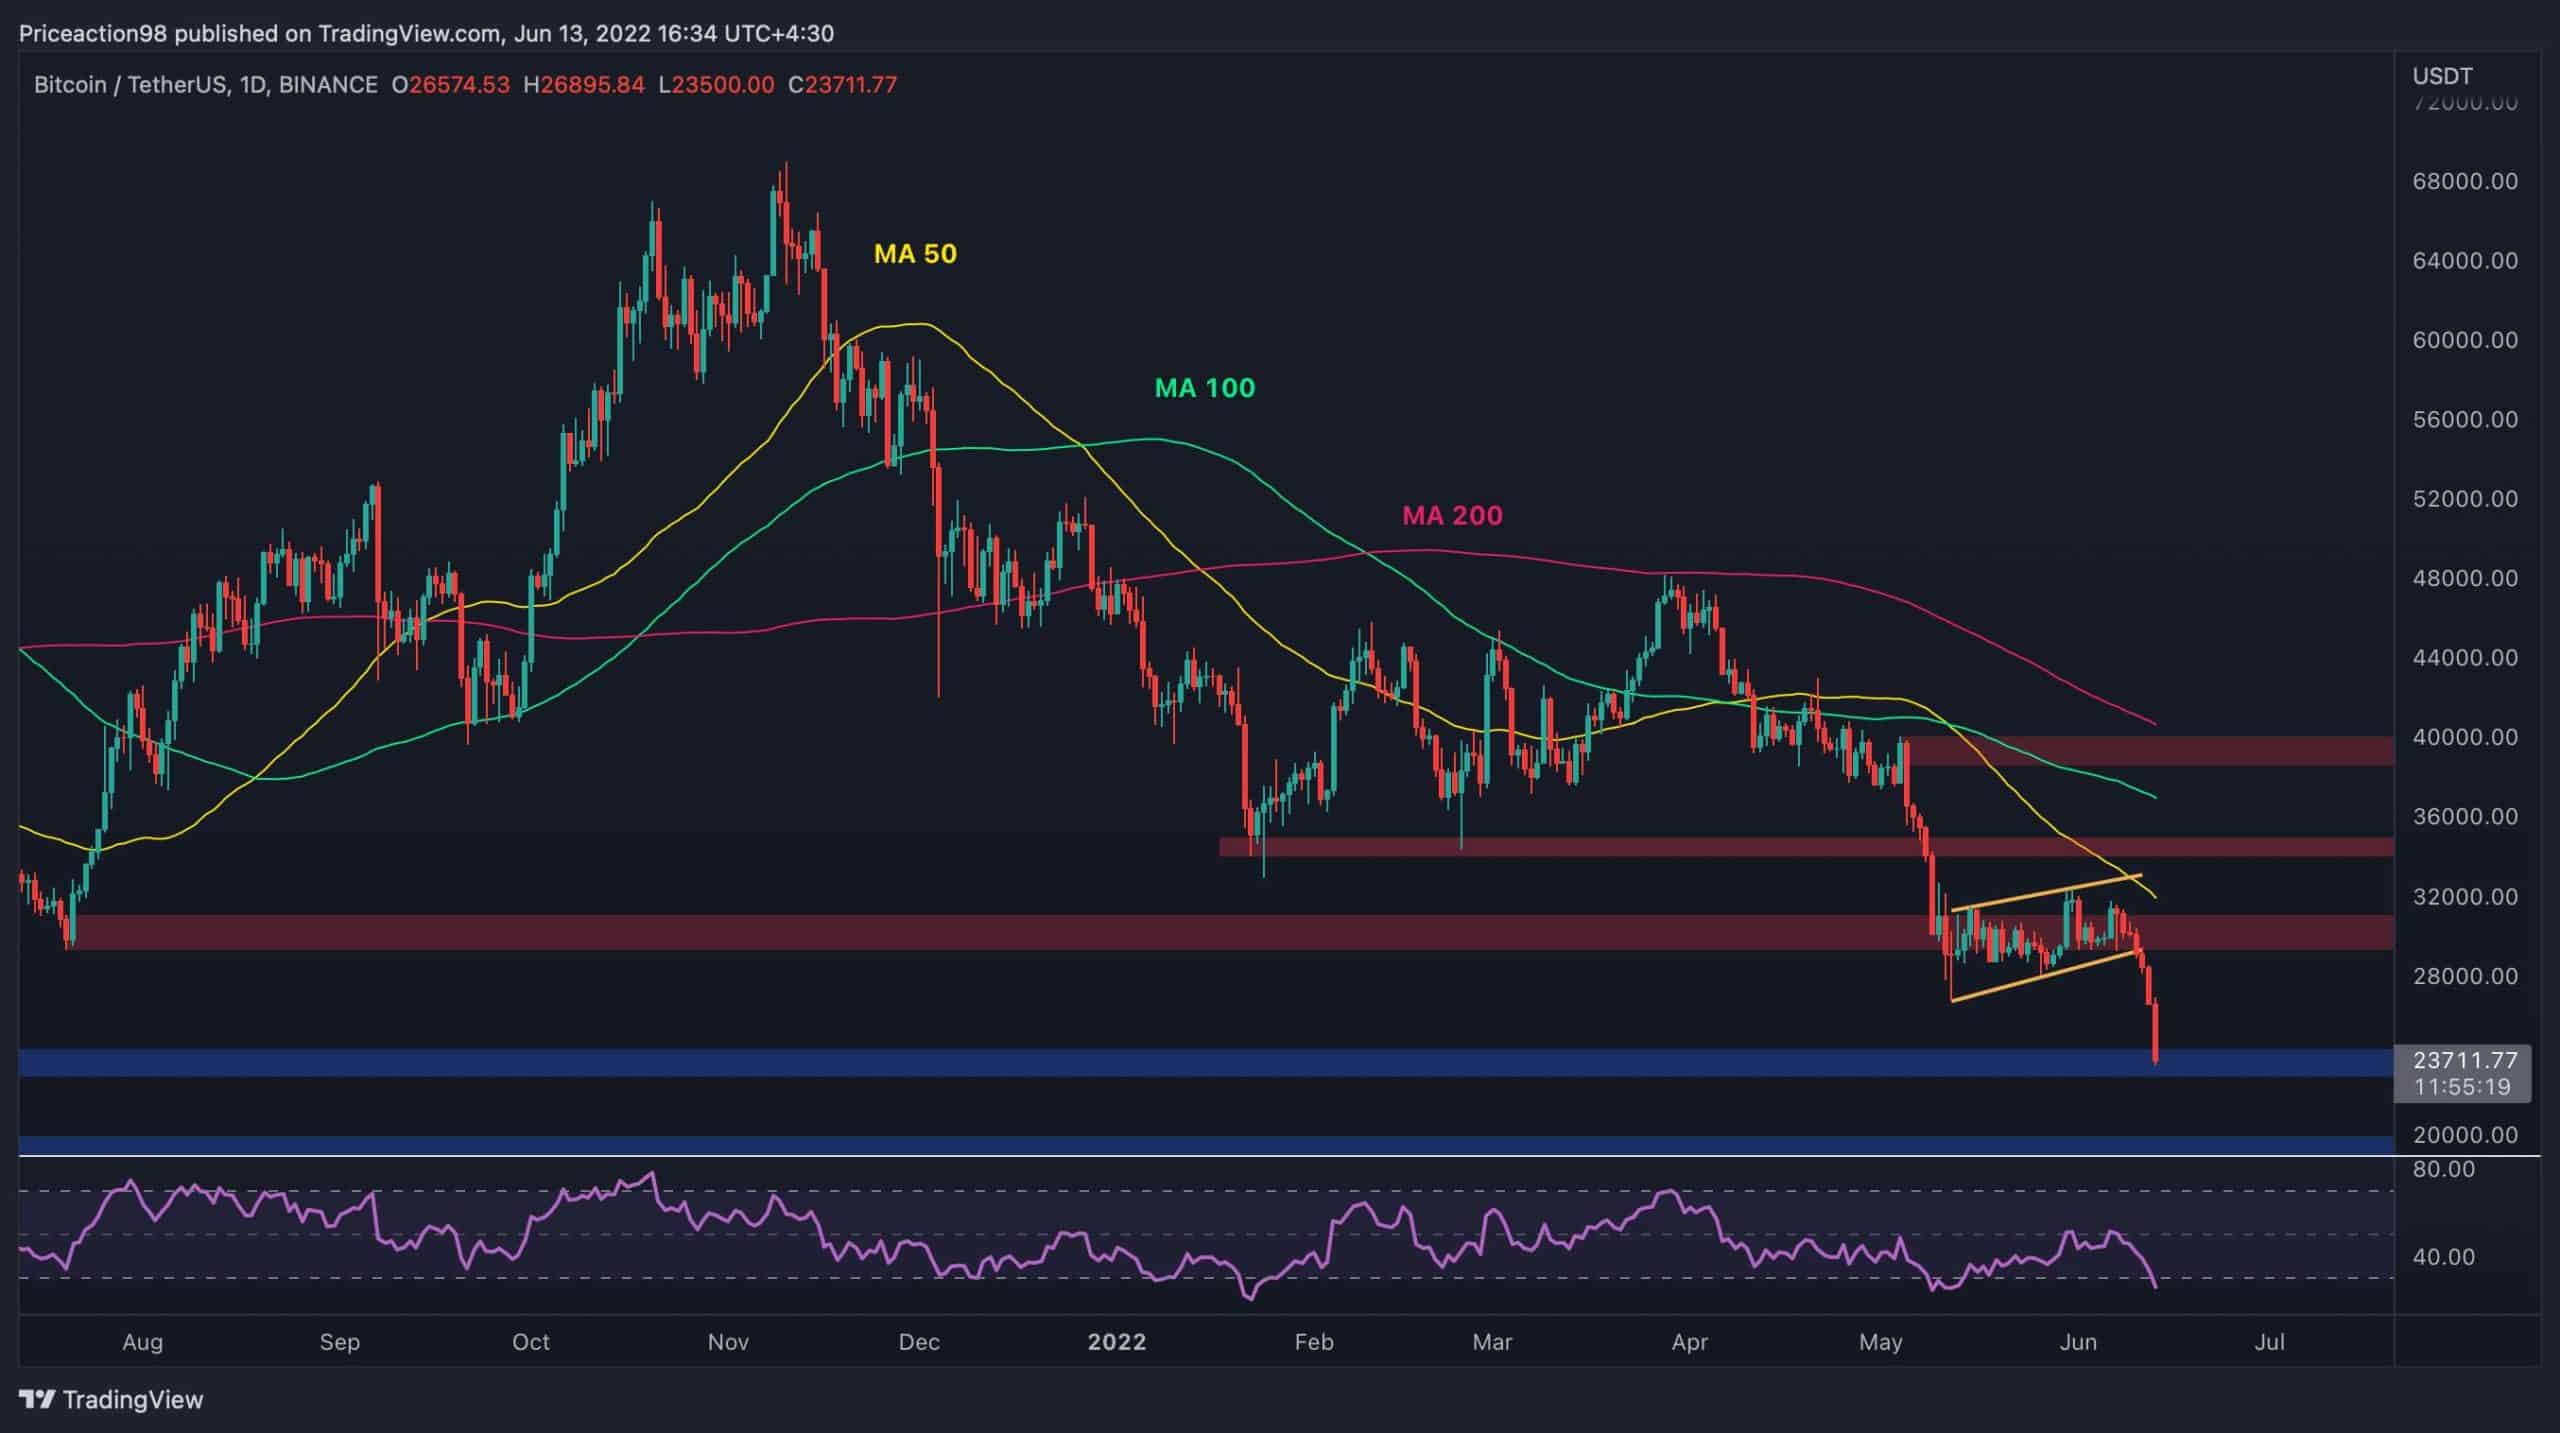
តារាងប្រចាំថ្ងៃ
Bitcoin has been dropping rapidly over the past few days and is currently testing the $23K-$24K demand zone. The price action on the lower timeframes should be closely monitored at this level to determine whether a bullish rebound could be expected.
The RSI has also entered the oversold region once again, and a short-term pullback from this level is probable. This is further supported by the fact that the monthly BTC RSI has never been lower than it is right now. However, even in this case, the $30K level would be a very strong resistance and would be accompanied by the 50-day moving average – a combination which could reject the price to the downside and towards the $17K-$20K area.

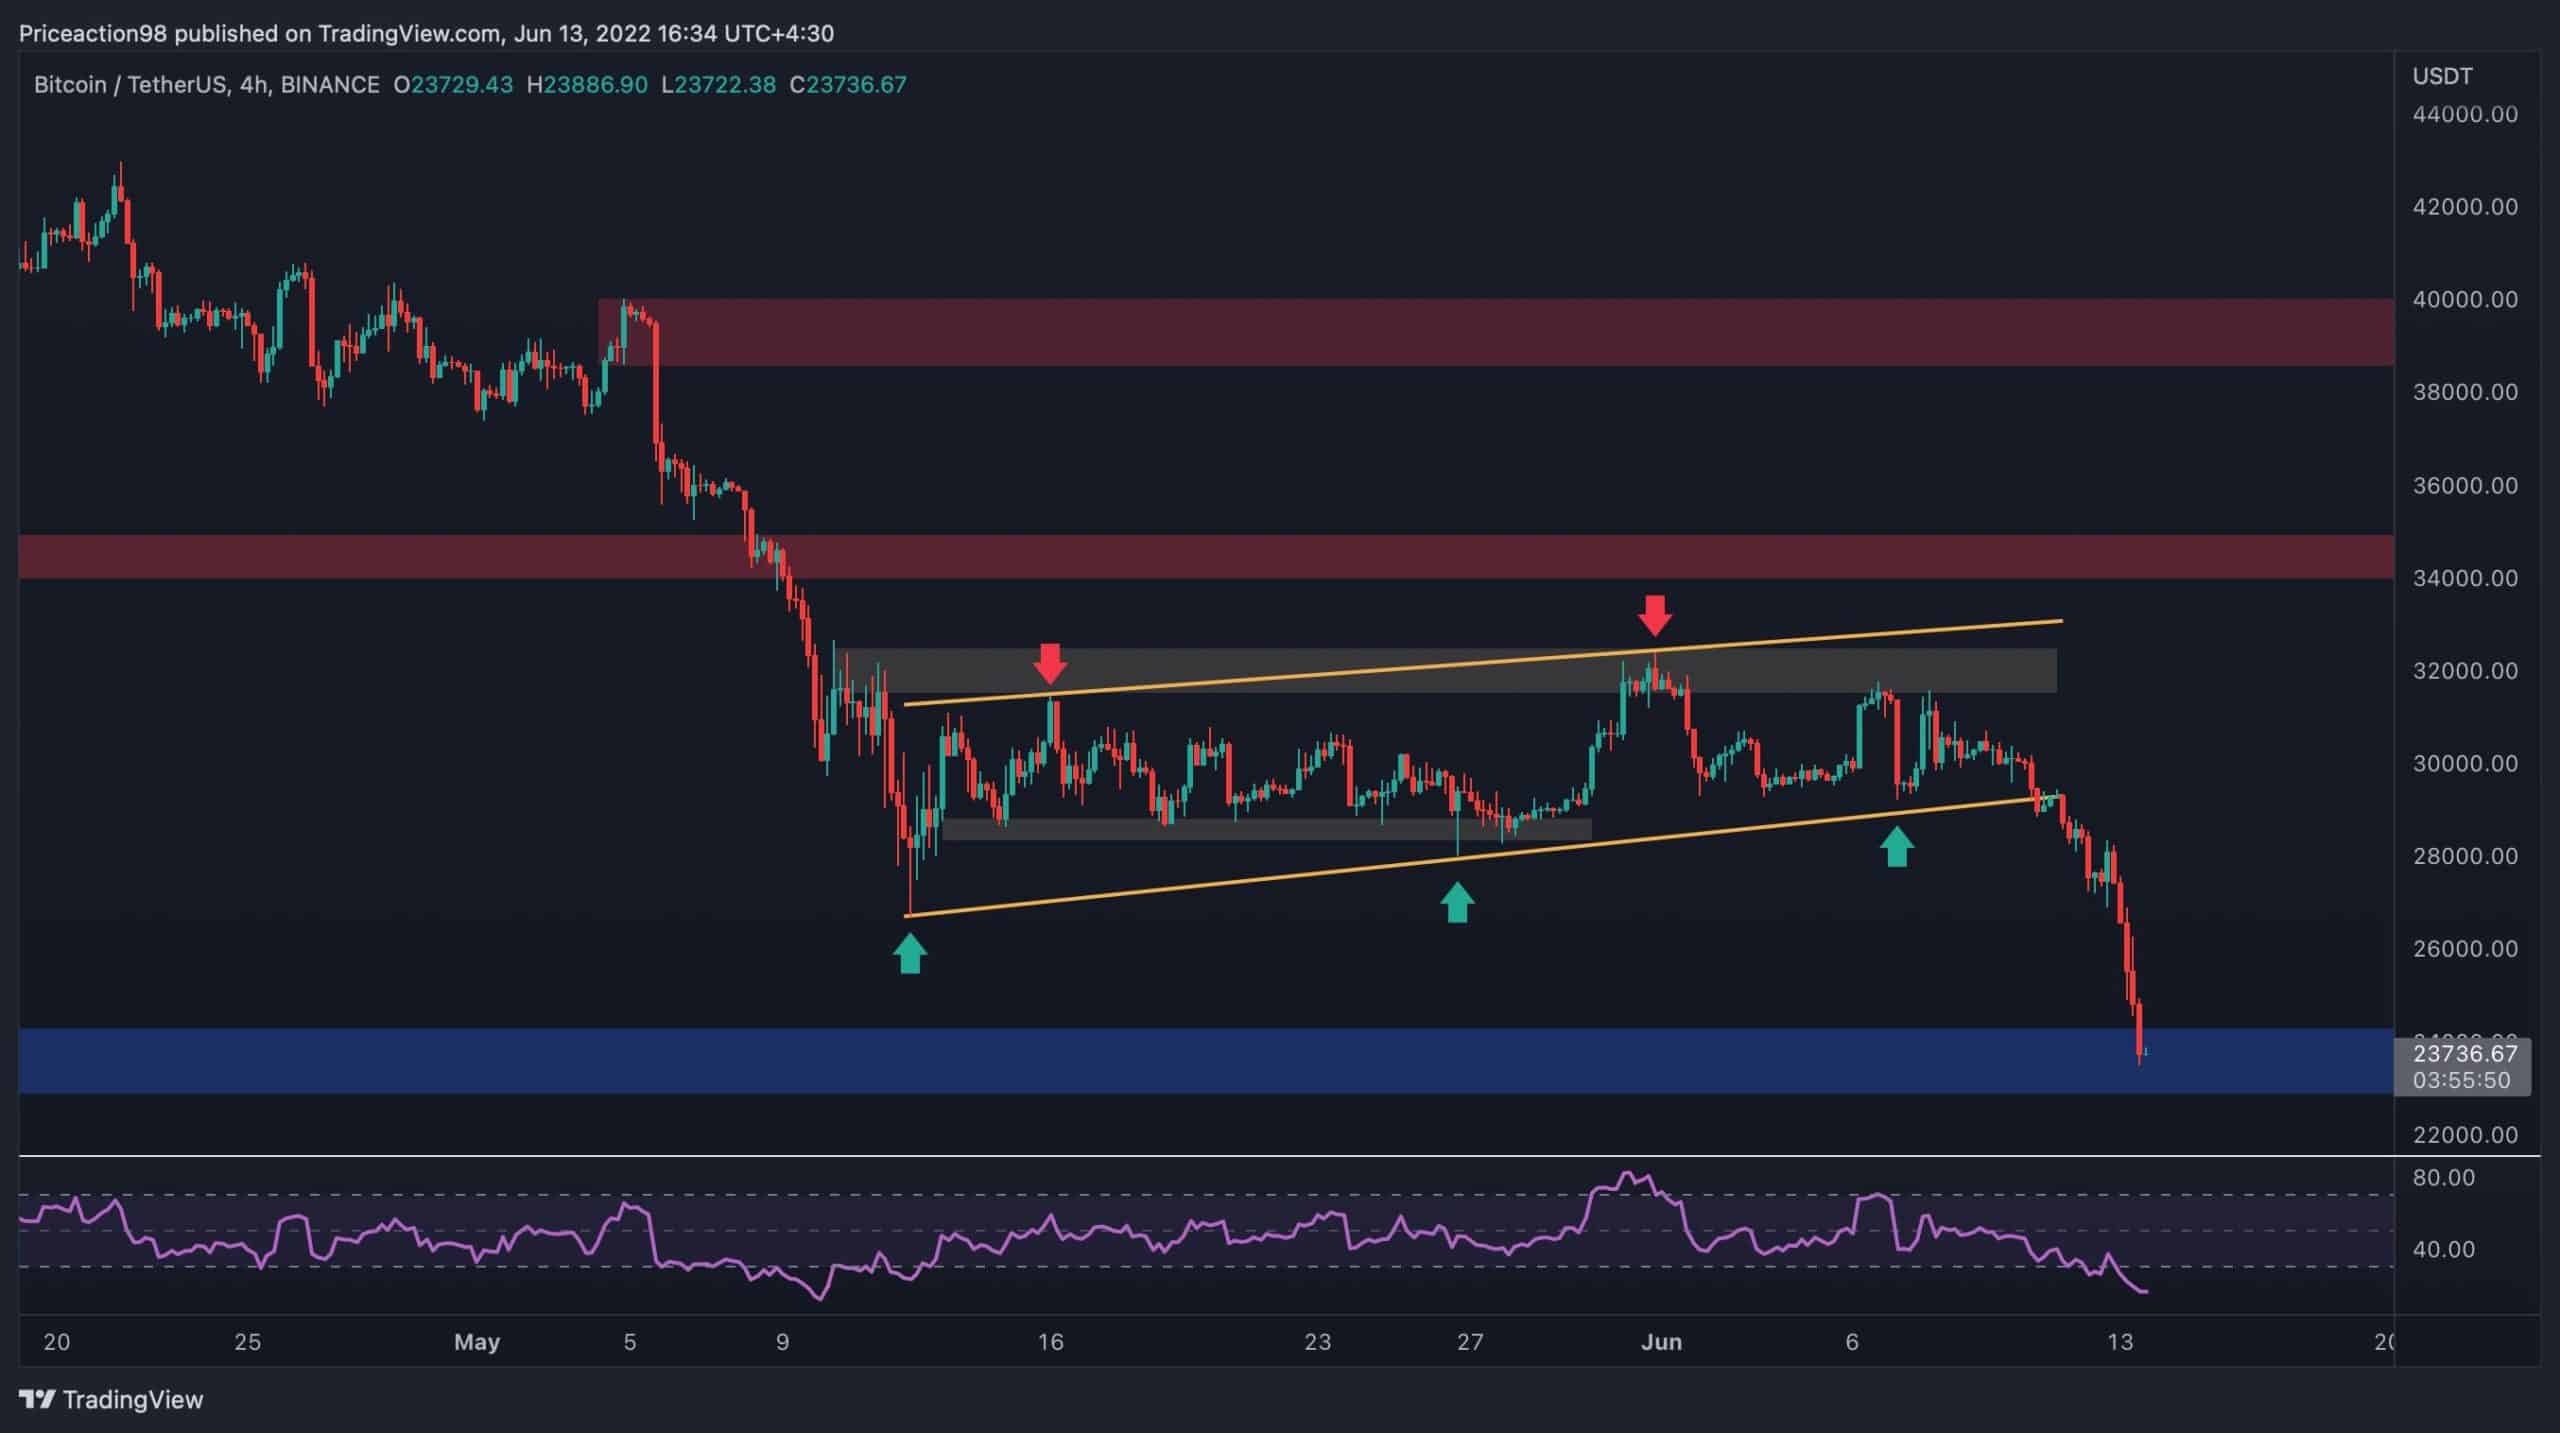
គំនូសតាង 4 ម៉ោង។
On the 4-hour timeframe, it is evident that while the price was oscillating in the bearish flag pattern, the $32K resistance level held the price on multiple occasions, and the bearish impulse which broke the flag to the downside was initiated after the price failed to break above this resistance level once again.
During the last test of the $32K resistance level, the RSI had values around 50, which indicated that the momentum would not be sufficient for a bullish breakout. Currently, the price is trading at the $24K demand level, and the RSI has entered an oversold state (below 30). This observation points to a probable bullish correction or consolidation in this area in the short term before a potential continuation to the downside.
ការវិភាគលើសង្វាក់
By សាយ៉ាន
This chart consists of the mean amount of coins per transaction sent to the exchange(SMA-30) and Bitcoin’s price. High values of the metric indicate investors are sending a greater number of coins in a transaction. It indicates higher selling pressure which could lead to a future price drop.
Historically, during the capitulation phase of the market and late bear markets, this metric spikes and register a local high. This interprets significant selling pressure among participants and the capitulation event. The indicator has recently surged, followed by a steep decline in Bitcoin’s price.
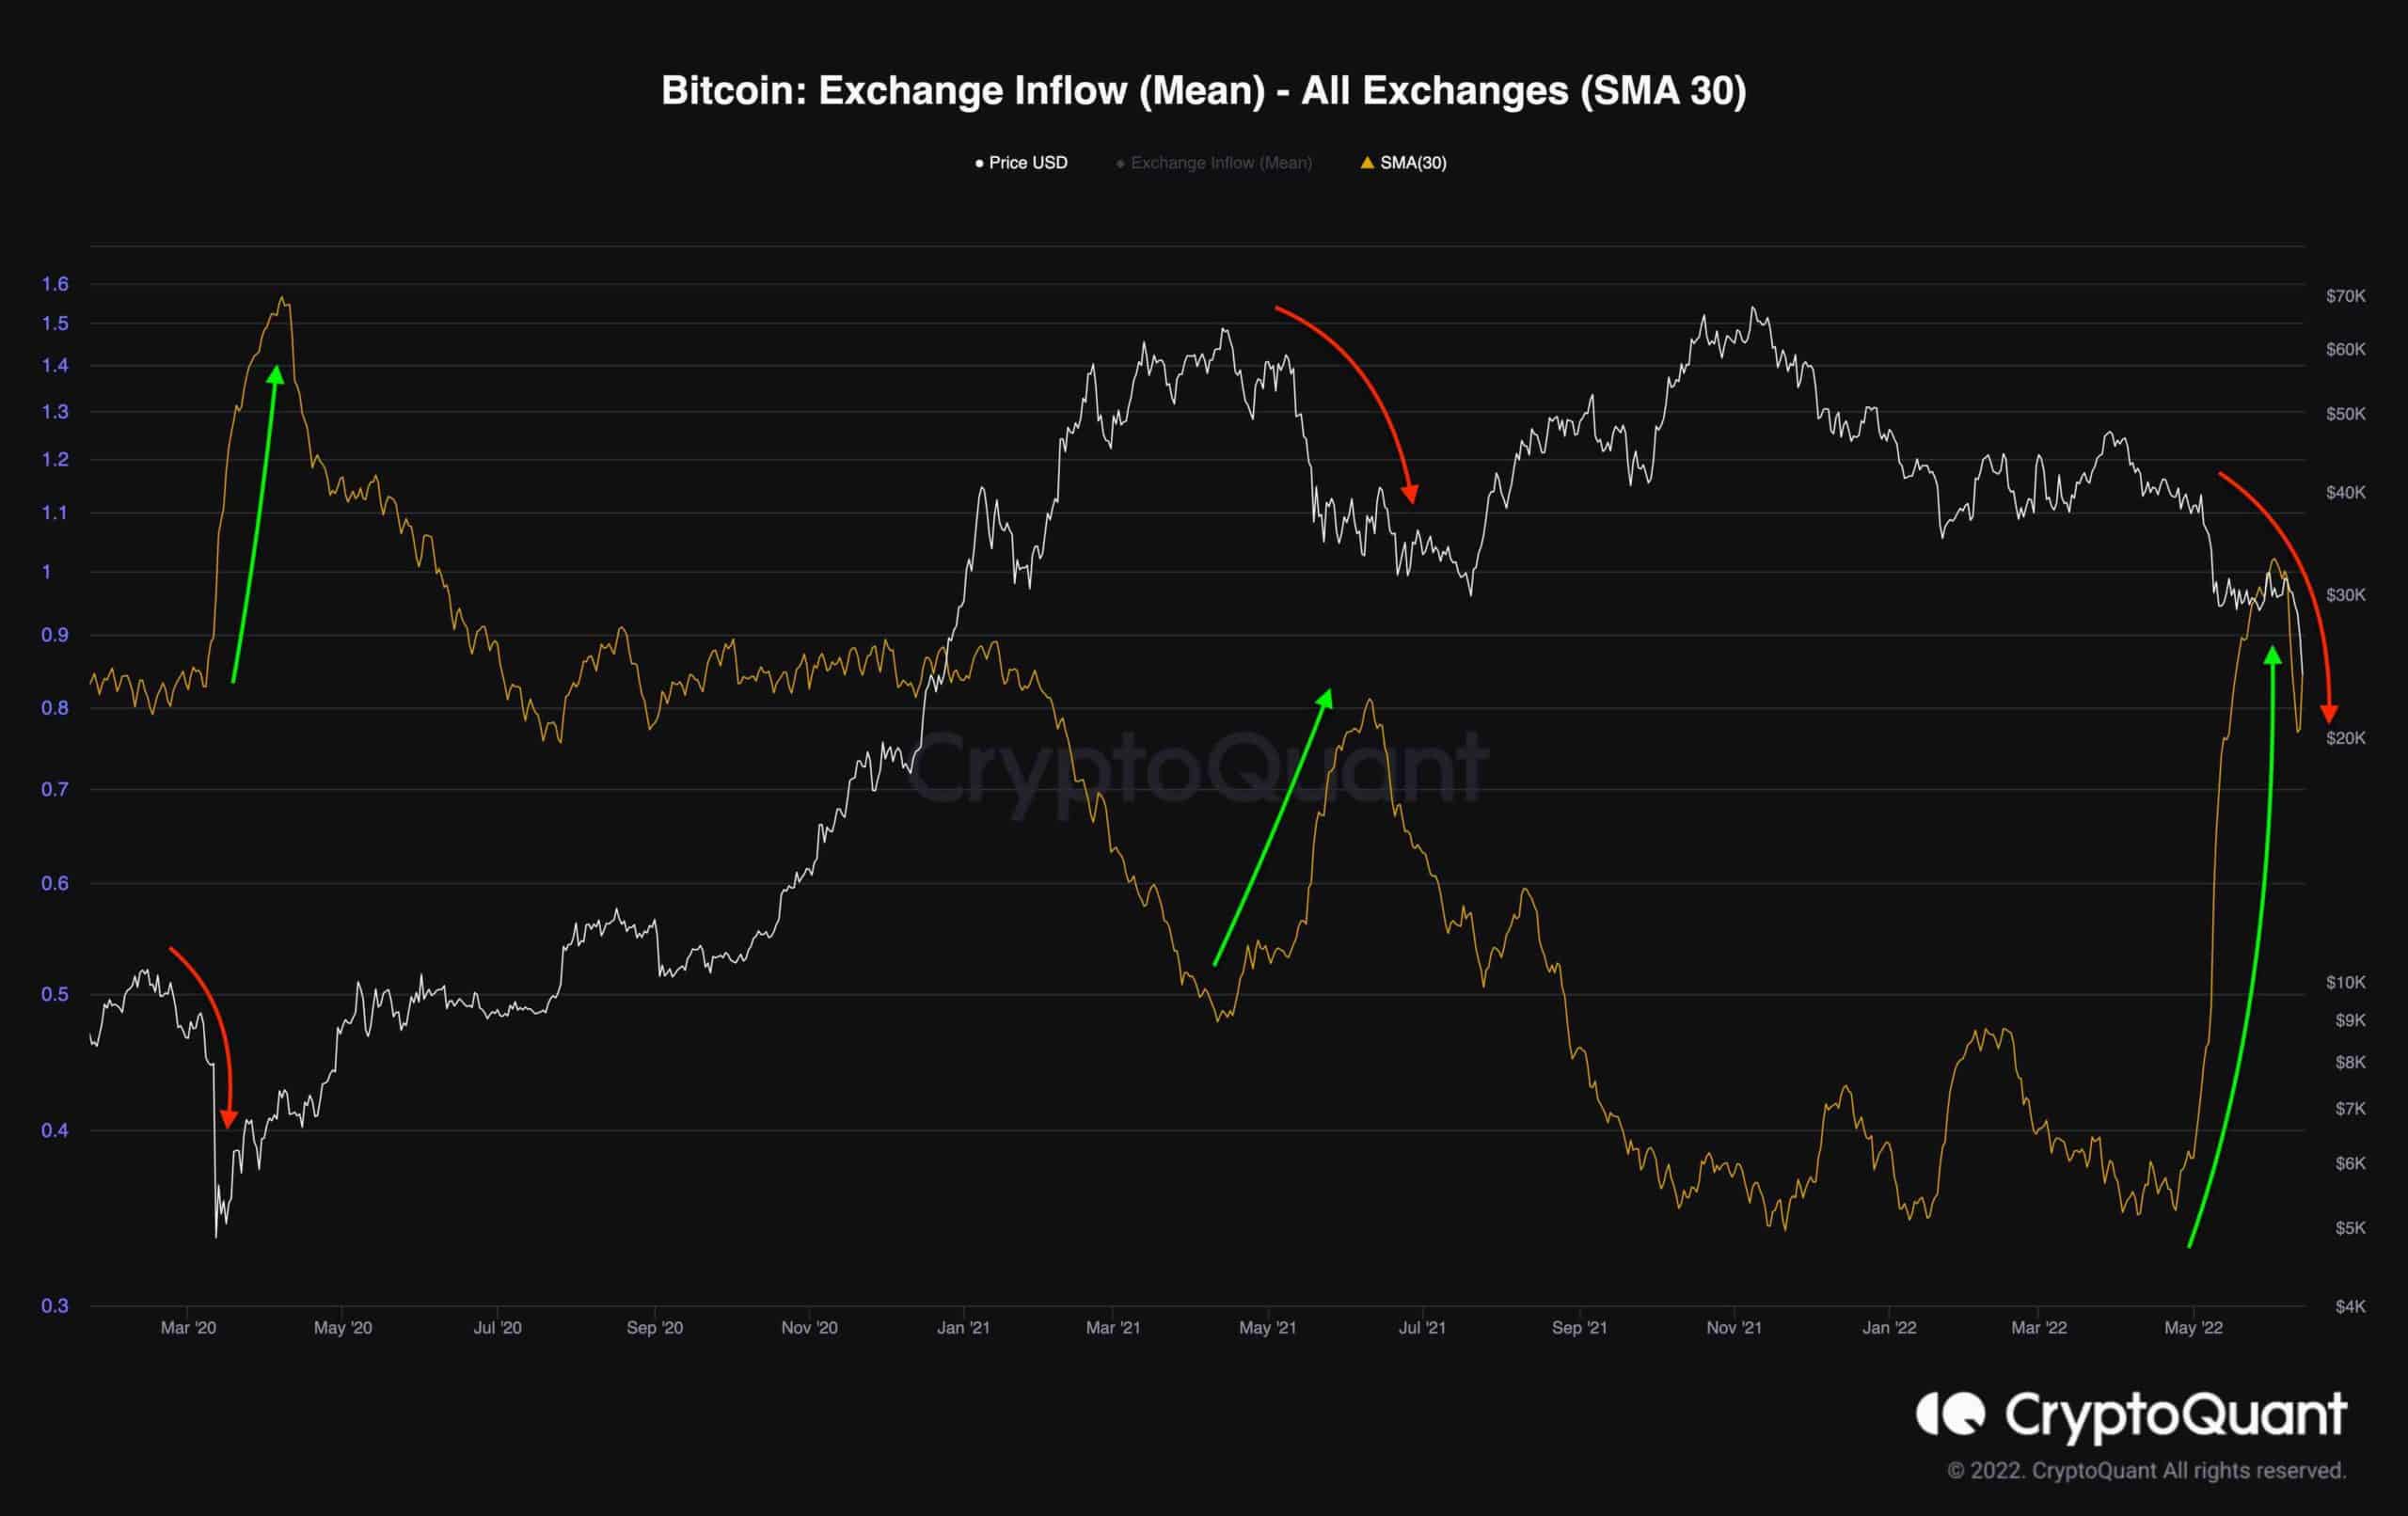
The bears have complete control of the market, and the overall sentiment is extremely negative. The next bull run will be expected only if the ongoing capitulation is over and then bullish sentiment returns to the market.
Binance ឥតគិតថ្លៃ 100 ដុល្លារ (ផ្តាច់មុខ): ប្រើតំណនេះ ដើម្បីចុះឈ្មោះ និងទទួលបាន $100 ឥតគិតថ្លៃ និងថ្លៃសេវា 10% លើ Binance Futures ខែដំបូង (លក្ខខណ្ឌ).
ការផ្តល់ជូនពិសេសរបស់ PrimeXBT៖ ប្រើតំណនេះ ដើម្បីចុះឈ្មោះ និងបញ្ចូលលេខកូដ POTATO50 ដើម្បីទទួលបានប្រាក់រហូតដល់ 7,000 ដុល្លារលើការដាក់ប្រាក់របស់អ្នក។
ការបដិសេធ: ព័ត៌មានដែលរកឃើញនៅលើគ្រីបតូប៉ូតូតូគឺជាព័ត៌មានរបស់អ្នកនិពន្ធ។ វាមិនតំណាងឱ្យគំនិតរបស់គ្រីបតូប៉ូតូតូថាតើត្រូវទិញលក់ឬកាន់កាប់ការវិនិយោគណាមួយទេ។ អ្នកត្រូវបានណែនាំឱ្យធ្វើការស្រាវជ្រាវដោយខ្លួនឯងមុនពេលធ្វើការសម្រេចចិត្តវិនិយោគណាមួយ។ ប្រើព័ត៌មានដែលបានផ្តល់ជូនតាមហានិភ័យរបស់អ្នក។ សូមមើលការបដិសេធសម្រាប់ព័ត៌មានបន្ថែម។
តារាង Cryptocurrency ដោយ TradingView ។
Source: https://cryptopotato.com/bitcoin-crashes-13-daily-is-20k-next-btc-price-analysis/