ថ្មី តម្លៃ Bitcoin analysis shows that the currency has experienced a bullish recovery over the last past few hours, with its value reaching $16,723 and gaining a 0.18% increase. However the bearish had earlier pushed the digital currency to a low of $16,700, but the bulls managed to defend the level and push it back above $16,723.
The nearest resistance for BTC is present at $16,800, and the currency appears to be gaining momentum heading into the near future. Support is also present at $16,673, which could help to provide some stability to BTC if the price begins to decline.
The 24-hour trading volume for Bitcoin also shows a strong uptick to $10.494 billion, and a market cap of $321 billion. In the past 24 hours, the bears and the bulls have both been active in the market, with a series of price swings occurring between these two forces. However, based on the current momentum and strong support levels at $16,673, it seems likely that Bitcoin will continue to see gains over the coming hours.
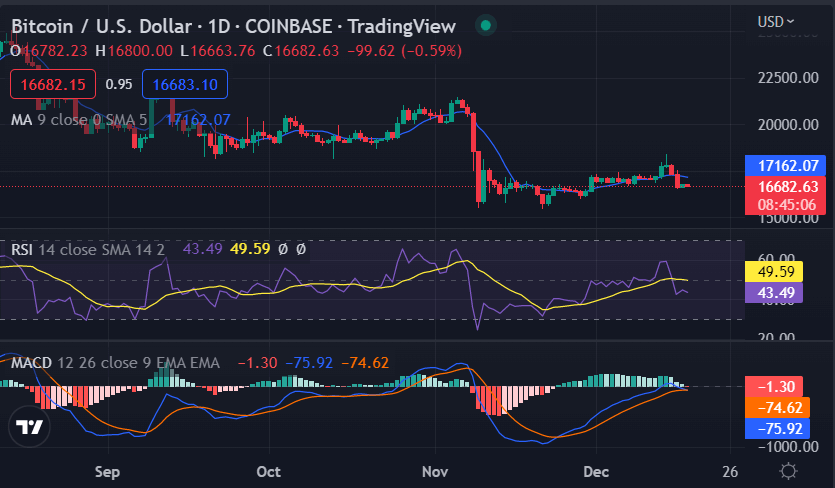
BTC/USD 1-day price chart: Price retouches $16,723 after overcoming a major loss
The price is on the rise once again as can be confirmed by the one-day Bitcoin price analysis. The bulls have been able to recover successfully as the price levels are now touching the $16,723 height. The past few days proved fatal for the coin value as its value went down quite regularly. But now the bulls are back on track and are on their way toward the moving average (MA) value which is at $17,162.

The BTC/USD price travels over the moving average curve indicating that the market is on a bullish trend. Bitcoin price analysis reveals that the Relative Strength Index (RSI) score is 49.59, making the cryptocurrency enter the inflation region. Furthermore, the RSI score moves upwards, indicating the buying activity exceeds the selling activity while moving toward overvaluation. The Histogram on the MACD indicator is increasing showing that the bears and bulls are fighting to take over the BTC market.
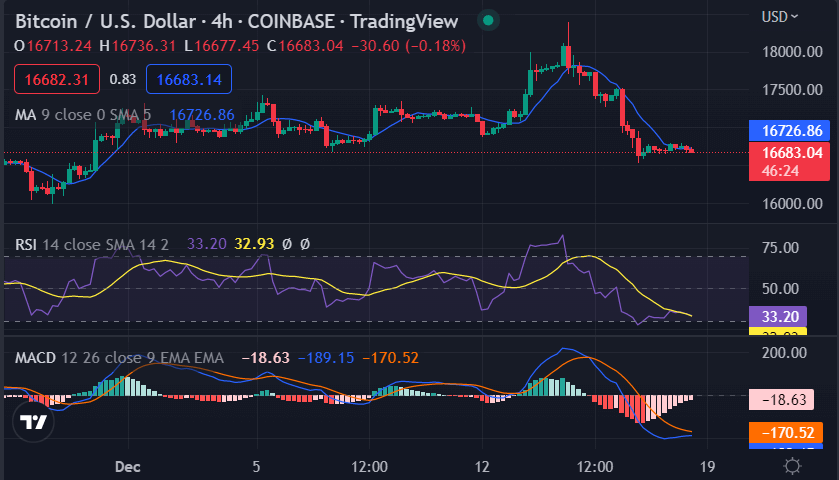
Bitcoin price analysis 4-hour price chart: BTC price appears to be gaining momentum
The current Bitcoin price analysis shows that the bears and bulls are fighting for control of the market, with a series of price swings occurring between them. With the bulls defending the level at $16,723, However, it appears that the bulls are currently winning as the 4-hour Bitcoin price analysis reveals.

Looking at the hourly price trend for technical indicators the price has travelled above its moving average (MA), which indicates that a bullish trend is prevailing. The RSI indicator evidences the buying activity in the market, which indicates an overvalued market. However, BTC price analysis also reveals that further gains are expected as long as the cryptocurrency remains above the $16,673 support level. The MACD is also showing bullish signals, as the signal line and the MACD line are moving closer to each other.
សេចក្តីសន្និដ្ឋានការវិភាគតម្លៃ Bitcoin
The overall Bitcoin price analysis shows that the bulls are dominating the market and have been able to recover successfully. The 4-hour chart further indicates that BTC/USD is gaining momentum, However, it appears likely that BTC will continue to see battles between the bulls and the bears in the near future.
ប្រភព៖ https://www.cryptopolitan.com/bitcoin-price-analysis-2022-12-18/