
- DOT has shown bullish actions in previous sessions.
- The pair of DOT/USDT is trading at the price level of $4.88 with a gain of 0.1% in the past 24 hours.
The recent crypto crisis caused by the failure of the FTX (FTT) cryptocurrency exchange has sent shockwaves across the market. Following the exchange’s insolvency, DOT fell to a 52-week low of $5.01 on 22 November and was worth at $4.88 at the time of writing on 10 January 2023.
Polkadot (DOT) candle faces rejection on daily time frame
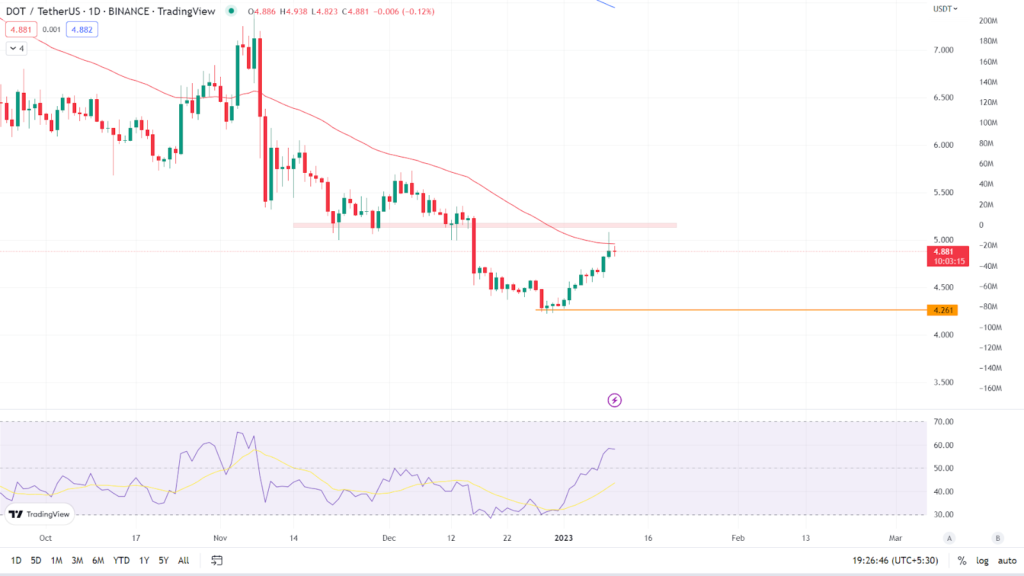
DOT is trading below the demand on a daily time frame, and it recently retraced to the demand zone. According to the daily chart, DOT is presently trading at $4.88, up 0.1% in the last 24 hours. The token is now trading below its key Moving Averages (50 and 200). (Red line is 50 EMA and the blue line is 200 EMA). Token faced rejection near 50 EMA and made a long upper wick with bears showing strength.

សន្ទស្សន៍កម្លាំងទាក់ទង៖ The asset’s RSI curve is presently trading at 58.64, indicating that it is in the overbought zone. The RSI curve has crossed above the 14 SMA, indicating bullishness. Although the indicator indicates bullish strength, the candle chart indicates bearish strength. We cannot make a trade just on the basis of an indicator; we must also consider other factors before taking a trade.
ទស្សនៈ & ការរំពឹងទុករបស់អ្នកវិភាគ
Token showed bullish momentum in previous days, but this is not a trend change; it is a pullback or retracement after a significant drop in token price. Token will continue its downward journey until it breaks above the resistance levels. Investors are advised not to buy now and to wait for trend confirmation. Intraday traders, on the other hand, have a strong opportunity to go short now that a long upper wick has developed on the daily time frame; stop loss should be placed as per risk to reward ratio.
Our current Polkadot price forecast indicates that in the next few days, the value of Polkadot will decrease by -1.98% and reach $ 4.80. Our technical indicators indicate that the current sentiment is Neutral, while the Fear & Greed Index reading is 26. (Fear). In the previous 30 days, Polkadot saw 6.46% price volatility and 17/30 (57%) green days. Our Polkadot outlook indicates that now is not a good moment to buy Polkadot.
កំរិតបច្ចេកទេស
ជំនួយសំខាន់: $4.261
ការតស៊ូសំខាន់: $ 5.177
សន្និដ្ឋាន
On a daily time frame, the price of DOT tokens has fallen below the demand zone. The price of the DOT cryptocurrency is forming a bearish chart pattern based on price action. Investors should watch for a clear indication before acting.
ការមិនទទួលខុសត្រូវ: ទស្សនៈ និងគំនិតដែលសរសេរដោយអ្នកនិពន្ធ ឬមនុស្សណាម្នាក់ដែលមានឈ្មោះក្នុងអត្ថបទនេះគឺសម្រាប់តែគំនិតព័ត៌មានប៉ុណ្ណោះ ហើយពួកគេមិនបង្កើតហិរញ្ញវត្ថុ ការវិនិយោគ ឬដំបូន្មានផ្សេងទៀតទេ។ ការវិនិយោគលើ ឬជួញដូរទ្រព្យសកម្មគ្រីបតូមកជាមួយហានិភ័យនៃការបាត់បង់ហិរញ្ញវត្ថុ។
Source: https://www.thecoinrepublic.com/2023/01/11/dot-price-analysis-token-is-rejected-at-the-50-ema-and-formed-a-long-upper-wick/