- GRT has shown a bullish action in recent sessions
- The GRT token price is bullish as it breaks descending triangle pattern on a daily time frame
After a great 2021 for both the graph (GRT) and the crypto market, things didn’t go so wonderfully in 2022. For a long time, the token has been trading in a downtrend, with lower highs and lower lows.
Token breaks out of descending triangle pattern
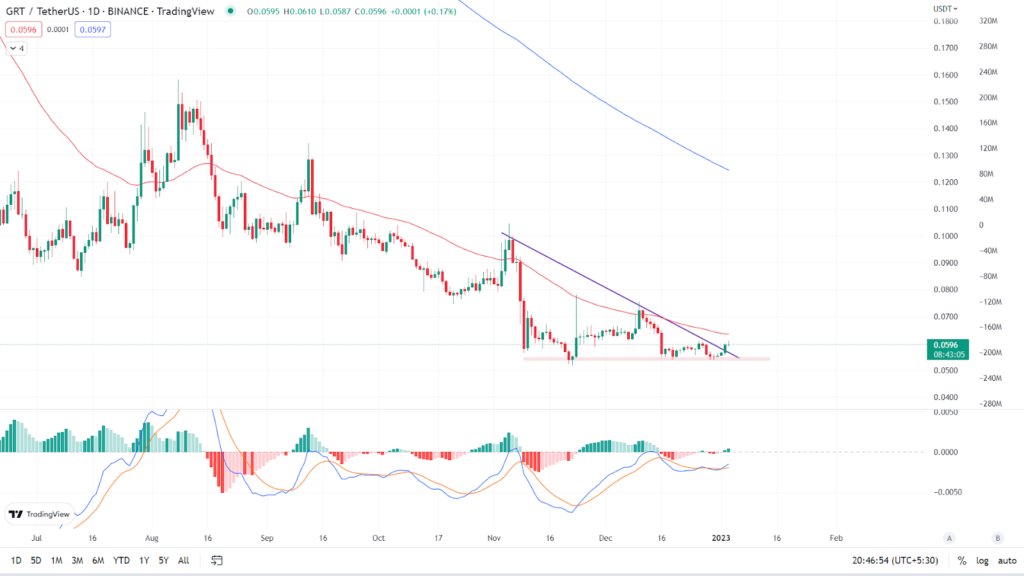
GRT, unlike any other cryptocurrency, is constantly falling in value, with investors losing money and no new investors ready to take the risk. The daily chart shows that GRT is now trading at $0.0596. The overall trend of the token is bearish, with lower highs and lower lows. The price is now trading below its major Moving Averages (50 and 200 EMA). (Red line is 50 EMA and the blue line is 200 EMA). Token has recently given an upward breakthrough of the Descending triangle pattern, with MACD supporting the breakout.
MACD: MACD has given a bullish crossover and token has given a bullish breakout of the Descending triangle pattern. The MACD line is blue, while the signal line is yellow. Bullish crossover occurs when the MACD line crosses the signal line in an upward direction, and vice versa.

ទស្សនៈ & ការរំពឹងទុករបស់អ្នកវិភាគ
The token has broken out of the Descending triangle pattern, showing bullish momentum. A significant resistance level exists at the 50 EMA. Price will struggle to cross and remain above the 50 EMA. For a long time, the token has been unable to cross the 50 EMA. Investors should avoid buying right now and instead wait for the token to cross and sustain above the 50-day moving average (EMA) to confirm the short-term bullish trend. If the price goes below $0.0530, intraday traders have a strong chance to go short.
According to our current The Graph price prediction, the value of The Graph is expected to rise by 3.19% in the next few days, reaching $ 0.061710. Our technical indicators indicate that the current sentiment is Neutral, with the Fear & Greed Index reading 26. (Fear). Over the previous 30 days, the graph shows 14/30 (47%) green days and 7.36% price volatility. According to our The Graph forecast, this is a good moment to buy The Graph if it remains above the 50 EMA.
កំរិតបច្ចេកទេស
ជំនួយសំខាន់: $0.0530
ការតស៊ូសំខាន់: $ 0.0634
សន្និដ្ឋាន
GRT is looking well and showing bullish momentum. Long-term investors can buy when the token crosses above the 50 EMA and sustains its position. Intraday traders can buy now and reach their targets up to the 50 EMA.
ការមិនទទួលខុសត្រូវ: ទស្សនៈ និងគំនិតដែលសរសេរដោយអ្នកនិពន្ធ ឬមនុស្សណាម្នាក់ដែលមានឈ្មោះក្នុងអត្ថបទនេះគឺសម្រាប់តែគំនិតព័ត៌មានប៉ុណ្ណោះ ហើយពួកគេមិនបង្កើតហិរញ្ញវត្ថុ ការវិនិយោគ ឬដំបូន្មានផ្សេងទៀតទេ។ ការវិនិយោគលើ ឬជួញដូរទ្រព្យសកម្មគ្រីបតូមកជាមួយហានិភ័យនៃការបាត់បង់ហិរញ្ញវត្ថុ។
Source: https://www.thecoinrepublic.com/2023/01/10/grt-technical-analysis-token-breaks-out-from-the-descending-triangle-pattern/