តម្លៃ Litecoin analysis for today shows that the market conditions have turned bearish, pushing prices below the $53.54 mark. The bears have been in control of the market for the last two days, pushing prices down from $56.06 to the current level. Resistance for the asset is present at $54.24, and a break above this level is required for prices to move higher. On the downside, support is present at $52.22, and a break below this level could see prices falling to $50.

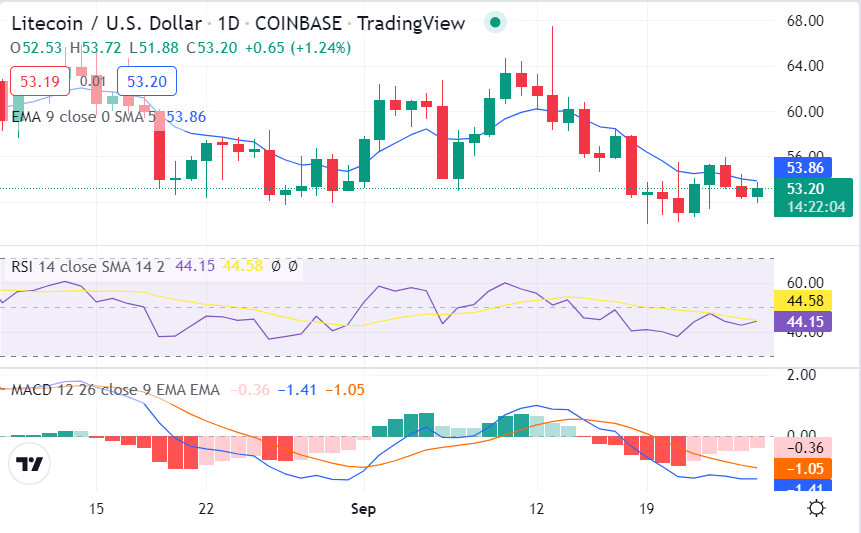
LTC/USD 1-day price chart: Recent setback turns price down to $53.54 mark
The 1-day Litecoin price analysis shows the coin is continuing downside below the $54 psychological mark as it is trading hands at $53.54 at the time of writing. The LTC/USD pair shows a loss of 1.30 percent in price value for the last 24 hours, and the weekly loss has increased to 8.71 percent for the past week. The trading volume for the day is recorded at $451 million, and the market capitalization is currently at $3.80 billion.

The RSI indicator for the pair shows a bearish divergence as it is moving below the 50 levels, signaling that selling pressure could continue to put pressure on prices in the near term. The exponential moving averages are placed below the candlesticks, which is a bearish sign for prices. The 20 EMA is placed at $53.86, and the 50 EMA is placed at $53.20. The MACD indicator shows a bearish crossover as the signal line crosses below the histogram, signaling that prices could continue to move lower in the near term.
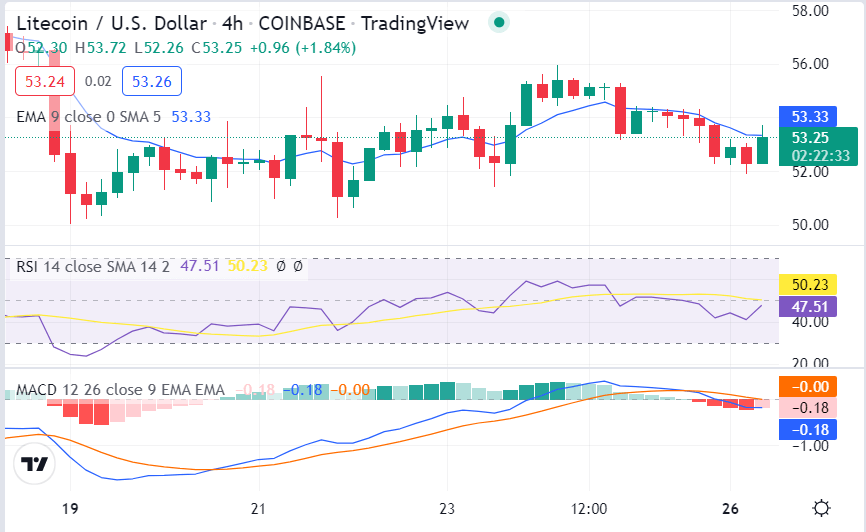
Litecoin price analysis 4-hour price chart: LTC/USD pair in a bearish trend
The 4-hour price chart for Litecoin price analysis shows the coin is at a loss for the day as the price is on the decreasing side, but bulls are also trying to make a comeback. The selling pressure has been pushing prices down since the beginning of the day, with the price falling from $54.24 to the current level at $53.54.This indicates that the bears are in control of the market at the moment.

The 4-hour RSI is also hovering at a straight line around the 50 levels, which signals that the market is indecisive at the moment. The 20 EMA is placed at $53.33, and the 50 EMA is placed below the candlesticks at $53.25. The moving average convergence divergence indicator on a 4-hour time frame is below the zero line, which shows that the market is in a bearish trend.
ការសន្និដ្ឋានវិភាគតម្លៃ Lite Lite
The Litecoin price analysis is on the bearish side, and the coin is under market pressure right now. The hourly and daily technical indicators are indicating that the bears are in control of the market. The price needs to break above the $54 mark for bulls to make a comeback, and if they do, prices could move higher towards $55.55 and $56 levels in the near term.
ការបដិសេធ។ ព័ត៌មានដែលបានផ្តល់មិនមែនជាដំបូន្មានពាណិជ្ជកម្មទេ។ Cryptopolitan.com មិនទទួលខុសត្រូវចំពោះការវិនិយោគណាមួយដែលធ្វើឡើងដោយផ្អែកលើព័ត៌មានដែលបានផ្តល់ជូននៅលើទំព័រនេះទេ។ យើងសូមណែនាំឱ្យធ្វើការស្រាវជ្រាវឯករាជ្យនិង / ឬពិគ្រោះយោបល់ជាមួយអ្នកជំនាញដែលមានសមត្ថភាពមុនពេលធ្វើការសម្រេចចិត្តវិនិយោគណាមួយ។
ប្រភព៖ https://www.cryptopolitan.com/litecoin-price-analysis-2022-09-26/
