
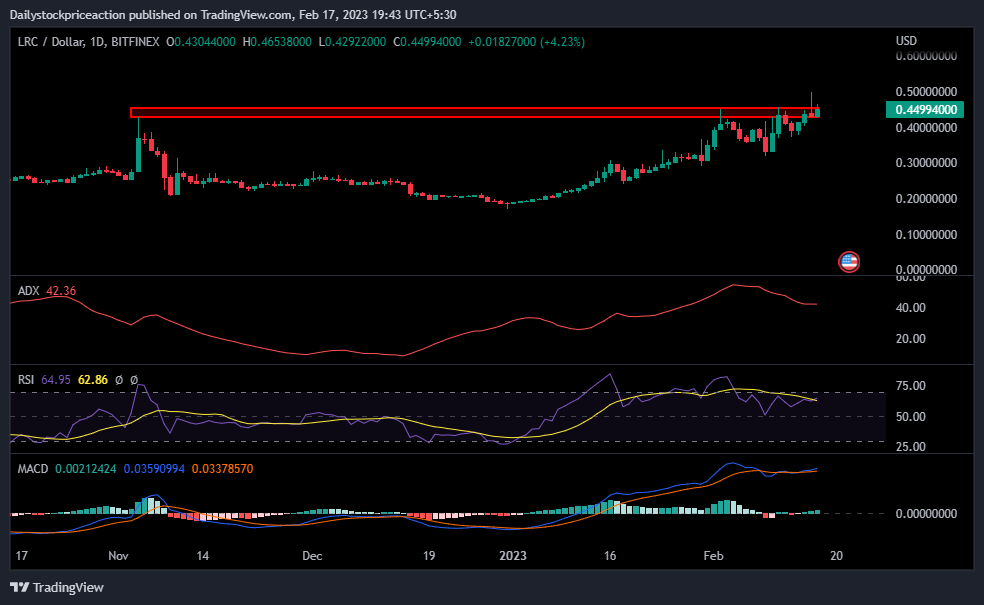
- The LRC token price is in a strong uptrend as it broke the small-term supply zone on a daily time frame.
- The LRC token price is forming a rounding bottom pattern on a daily time frame.
- The pair of LRC/BTC is trading at the price level of 0.000001912 with an increase of 6.98% in the past 24 hours.
The LRC token price, as per the price action, is in a strong uptrend as it broke the supply zone. As of now, it has started consolidating near the long-term supply zone. After showing a bullish rally off the demand zone, the LRC token price has now fallen after rising to the supply zone. As a result, the token price has formed a bullish rounding bottom pattern.
LRC token tackles the bearish pressure

The LRC token price has started forming higher high and higher low formations on a daily time frame. At present, the LRC token price is trading in the middle of the Bollinger band indicator after failing to surpass the upper band. The LRC token price has gone past the 20 EMA and therefore the LRC token price can take support moving upwards.
The LRC token price has also crossed the 50 and 25 Moving Averages. Going forward these MAs can act as a strong demand zone. Volumes have increased as the token price bounced off the demand zone strongly. Investors should wait for a breakout of the supply zone and then act accordingly.
The LRC token price is trading in a small range on a daily time frame
ខ្សែកោង ADX បាននិងកំពុងកើនឡើងនៅលើស៊ុមពេលវេលាកាន់តែខ្ពស់ ខណៈដែលសញ្ញាសម្ងាត់នៅតែបន្តកើនឡើង។ វាជាសញ្ញាវិជ្ជមានសម្រាប់តម្លៃនិមិត្តសញ្ញា។ នៅក្នុងស៊ុមពេលវេលាប្រចាំថ្ងៃ ខ្សែកោង ADX បានធ្លាក់ចុះពីសញ្ញា 20 ហើយបានប្រែទៅជាឡើងលើ។ ដោយសារតម្លៃសញ្ញាសម្ងាត់ស្ថិតនៅតំបន់តម្រូវការរយៈពេលខ្លីនៅលើស៊ុមពេលវេលា 4 ម៉ោង។ វិនិយោគិនគួរតែរង់ចាំការបង្កើតទៀនវិជ្ជមាននៅតំបន់តម្រូវការ។
RSI curve is trading at the level of 42.51. The RSI curve is yet to cross the halfway mark of 50. The LRC token price has given a breakout of a strong small-term supply zone on a daily time frame. Once the token price breaks the rounding bottoms pattern, the RSI curve can be seen moving up rapidly. The RSI curve has crossed the 14 EMA yellow line indicating a short-term bullishness. The breakout of the bullish chart pattern will result in the RSI curve crossing the halfway mark of 50, supporting the breakout.
MACD indicator has been positive as the token price hovers around the supply zone. The MACD indicator gave a positive crossover where the blue line crossed the orange line on the upside. Once the LRC token price crosses the rounding bottom of the chart pattern supply zone, the MACD lines can be widening supporting the trend.
សេចក្តីសន្និដ្ឋាន: The LRC token price is super bullish for the last couple of days and the same is seen on the chart. The price action and the technical parameters suggest the same. It remains to see if the token price will break the supply zone or face rejection and falls.
ការគាំទ្រ: $ 0.32 និង $ 0.36
តស៊ូ: $ 0.47 និង $ 0.51
ការមិនទទួលខុសត្រូវ
ទស្សនៈ និងគំនិតដែលសរសេរដោយអ្នកនិពន្ធ ឬមនុស្សណាម្នាក់ដែលមានឈ្មោះក្នុងអត្ថបទនេះគឺសម្រាប់គោលបំណងផ្តល់ព័ត៌មានតែប៉ុណ្ណោះ ហើយពួកគេមិនបង្កើតហិរញ្ញវត្ថុ ការវិនិយោគ ឬដំបូន្មានផ្សេងទៀតទេ។ ការវិនិយោគលើ ឬជួញដូរទ្រព្យសកម្មគ្រីបតូមកជាមួយហានិភ័យនៃការបាត់បង់ហិរញ្ញវត្ថុ
Source: https://www.thecoinrepublic.com/2023/02/17/loopring-token-price-analysis-lrc-token-price-ready-for-a-move/