
- Paramount stock price formed double bottom reversal pattern
- NASDAQ: PARA stock price is up by 13.66% on the weekly basis and formed bullish engulfing candle
- PARA Q4 earnings estimate at $0.24 and revenue at $8.16B
Paramount Global(NASDAQ: PARA) stock price is trading with bullish cues and bulls seem to be in celebration mode ahead of Q4 earnings. According to the data from Yahoo Finance, PARA Q4 average earnings estimate remains positive at $0.24 and revenue at $8.16B which shows the belief of different analysts that the company is working hard to improve their financial performance.
In the previous session NASDAQ: PARA stock price closed at $24.54 with an intraday gain of 9.31% and the market cap stood at $16.082 Billion.

PARA stock prepares for short covering?
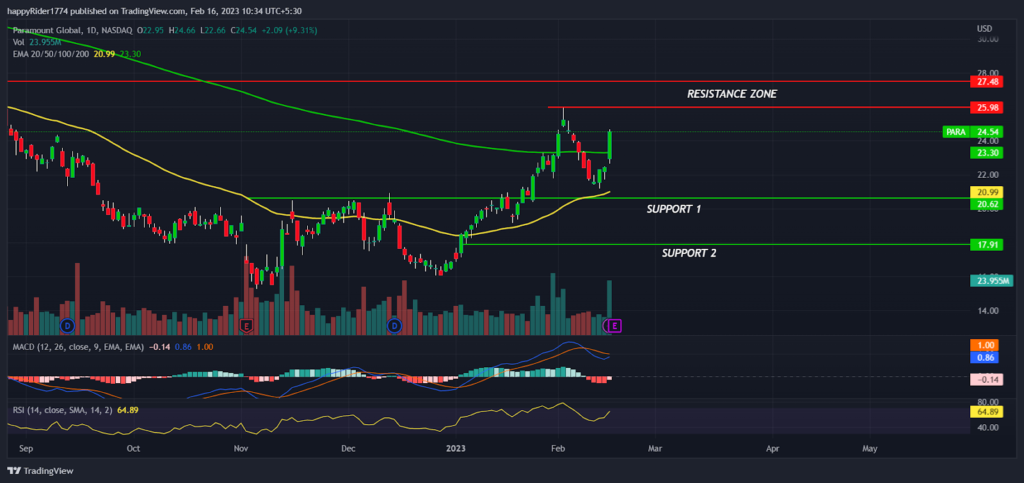
Paramount Global(NASDAQ: PARA) stock price has formed a double bottom pattern and reverse upward by forming fresh higher high candles which indicates that the investors are turning bullish for the future outlook of the company and expecting more upward momentum
នៅដើមខែមករា គ. សម្រាប់ stock prices had succeeded to reclaimed above the 50 day EMA which had derived a positive sentiment and prices shot up 45% in the short span of time. Meanwhile, the prices have also breakout of the neckline hurdle level of double bottom pattern at $21.00 which further grabbed the attention of investors and pushed the prices above the 200 day EMA which shows that the positional trend is reversing in the direction of bulls.
PARA stock has also witnessed a spike in its buying volume and prices took sharp bounce back from the support level indicating that some genuine buyers have taken long positions and are expecting the stock to outperform in the coming months. On the other hand, PARA prices are near to the supply zone at $25.98 and bears will try their best to give rejection from the higher levels. However, if the market sentiment remains positive and earnings meet the Q4 estimates then the probability of the upside breakout will increase in the favor of bulls.
The technical indicators of the PARA stock like MACD is tilting upward and on the way to generate a positive crossover indicates bullishness, RSI at 64 sloping north denotes that more room is left for the bulls and prices are far away from the overbought zone. However, if prices react negatively after the Q4 earnings then $20.00 will be acting as a strong support for the bulls and prices are expected to hold the support levels.
សេចក្តីសង្ខេប
Paramount Global(NASDAQ: PARA) stock price has shown a decent recovery from its 52 week low and succeeded to reverse the positional trend in the upward direction. The technical analysis suggests that if prices hold the 200 day EMA then probability of short covering rally will increase after the release of Q4 earnings. However, if prices drop below $20.00 then it turns out to be a matter of concern for the bullish traders as well as for long term investors.
កំរិតបច្ចេកទេស
កម្រិត Resistance៖ $25.98 និង $27.48
កម្រិតគាំទ្រ៖ 20.00 ដុល្លារ និង 17.91 ដុល្លារ
ការមិនទទួលខុសត្រូវ
ទស្សនៈ និងគំនិតដែលសរសេរដោយអ្នកនិពន្ធ ឬមនុស្សណាម្នាក់ដែលមានឈ្មោះក្នុងអត្ថបទនេះគឺសម្រាប់តែគំនិតព័ត៌មានប៉ុណ្ណោះ ហើយពួកគេមិនបង្កើតហិរញ្ញវត្ថុ ការវិនិយោគ ឬដំបូន្មានផ្សេងទៀតទេ។ ការវិនិយោគលើ ឬជួញដូរទ្រព្យសកម្មគ្រីបតូមកជាមួយហានិភ័យនៃការបាត់បង់ហិរញ្ញវត្ថុ។
Source: https://www.thecoinrepublic.com/2023/02/16/para-stock-surged-9-31-ahead-of-q4-earnings-is-more-rally-left/