- សញ្ញាសម្ងាត់បានបង្ហាញពីសកម្មភាពកើនឡើងនៅក្នុងវគ្គមុនៗ។
- The pair of XTZ/USDT is trading at the price level of $0.985 with a decrease of -0.4% in the past 24 hours.
According to price movement, the XTZ token price is negative on a daily basis. The overall negative trend in the cryptocurrency currency market appears to have influenced the token’s price. The token is trading below the demand zone on the daily time frame.
XTZ on the daily time frame
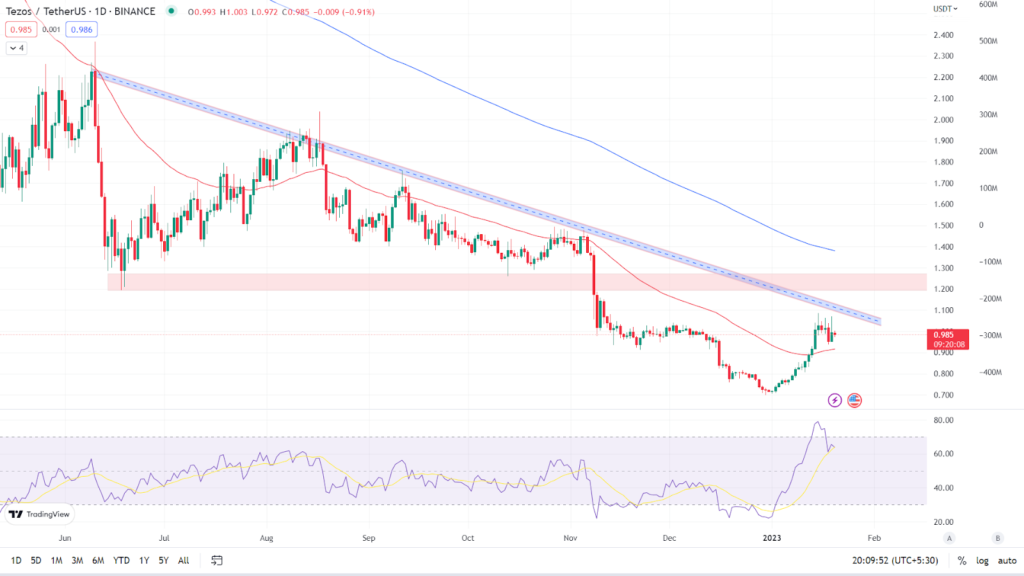
The token is in a long-term downtrend, with bears pushing the price down, forming lower highs and lower lows. According to the daily chart, the XTZ token is now trading at $0.985, indicating a -0.4% loss in the last 24 hours. It is now trading between its two major Moving Averages, the 50 EMA and the 200 EMA. (Red line is 50 EMA and the blue line is 200 EMA).
សន្ទស្សន៍កម្លាំងទាក់ទង៖ The asset’s RSI curve is currently trading at 64.81, indicating that it is in the overbought zone. The bullish momentum in the token over the last few days has increased the value of the RSI curve. The RSI curve has crossed over the 14 SMA, indicating that the market is bullish. The token’s overall view is bearish, and in order for the trend to reverse, the token must break the long term trend line on the daily time frame.

ទស្សនៈ & ការរំពឹងទុករបស់អ្នកវិភាគ
The token is trading below the long term trend line and is not able to break it and give closing on the daily time frame. Investors are advised to wait for the token to break and sustain the trend line before buying to gain more confirmation on the trend. Intraday traders, on the other hand, have good opportunities on both the buying and selling sides; if the token breaks above the trend line, they can go long; if the token faces rejection around the trend line, forms a strong bearish candle, and crosses the 50 EMA downward, they can go short.
According to our current Tezos (XTZ) price prediction, the value of Tezos (XTZ) will fall by -1.11% and reach $ 0.978564 in the coming days. Our technical indicators indicate that the current sentiment is bearish, with the Fear & Greed Index reading 51. (Neutral). Tezos had 18/30 (60%) green days with 12.02% price volatility in the previous 30 days. According to our Tezos projection, now is not the time to buy Tezos.
កំរិតបច្ចេកទេស
ជំនួយសំខាន់: $0.905
Major resistance: $1.049 & 1.271
សន្និដ្ឋាន
According to the price action, the token is trading in a downtrend, with the price forming a bearish chart pattern. Investors should wait for a clear indication before acting.
ការមិនទទួលខុសត្រូវ: ទស្សនៈ និងគំនិតដែលសរសេរដោយអ្នកនិពន្ធ ឬមនុស្សណាម្នាក់ដែលមានឈ្មោះក្នុងអត្ថបទនេះគឺសម្រាប់តែគំនិតព័ត៌មានប៉ុណ្ណោះ ហើយពួកគេមិនបង្កើតហិរញ្ញវត្ថុ ការវិនិយោគ ឬដំបូន្មានផ្សេងទៀតទេ។ ការវិនិយោគលើ ឬជួញដូរទ្រព្យសកម្មគ្រីបតូមកជាមួយហានិភ័យនៃការបាត់បង់ហិរញ្ញវត្ថុ។
Andrew គឺជាអ្នកអភិវឌ្ឍន៍ blockchain ដែលបានបង្កើតចំណាប់អារម្មណ៍របស់គាត់លើរូបិយប័ណ្ណគ្រីបតូខណៈពេលដែលគាត់បញ្ចប់ការសិក្សា។ គាត់ជាអ្នកសង្កេតមើលព័ត៌មានលម្អិត និងចែករំលែកនូវចំណង់ចំណូលចិត្តក្នុងការសរសេររួមជាមួយនឹងការក្លាយជាអ្នកអភិវឌ្ឍន៍។ ចំណេះដឹងផ្នែកខាងក្រោយរបស់គាត់អំពី blockchain ជួយគាត់ឱ្យផ្តល់នូវទស្សនៈតែមួយគត់ចំពោះការសរសេររបស់គាត់។
Source: https://www.thecoinrepublic.com/2023/01/21/xtz-price-analysis-bears-continue-their-downward-trend-will-bulls-gain-traction/