
- Zilliqa price is trading inside a descending triangle pattern over the daily chart.
- The crypto asset is trading below 20, 50, 100, and 200-days Daily Moving Average.
- គូនៃ ZIL/BTC គឺនៅ 0.000001671 BTC ជាមួយនឹងការធ្លាក់ចុះនៅថ្ងៃនេះ 0.73% ។
ហ្សីលីកា price got stuck inside a descending triangle pattern over the daily chart. The token is trying to gather the attention of bulls and falters to adapt to the uptrend momentum over the chart. ZIL investors need to wait for any directional change as the ZIL coin price has been consolidating in a range-bound and must escape the pattern to gain either of the steady momentum. The crypto asset has declined below the 20, 50, 100, and 200-days Daily Moving Average.
ហ្សីលីកា price is presently CMP at $0.049 and has lost 1.09% of its market capitalization in the last 24-hour period. Trading volume has also decreased by 27.63% in the intraday trading session. This shows that short-selling pressure is increasing over the token. Bears are trying to pull the token towards the crucial demand zone. The volume to market cap ratio is 0.1108.
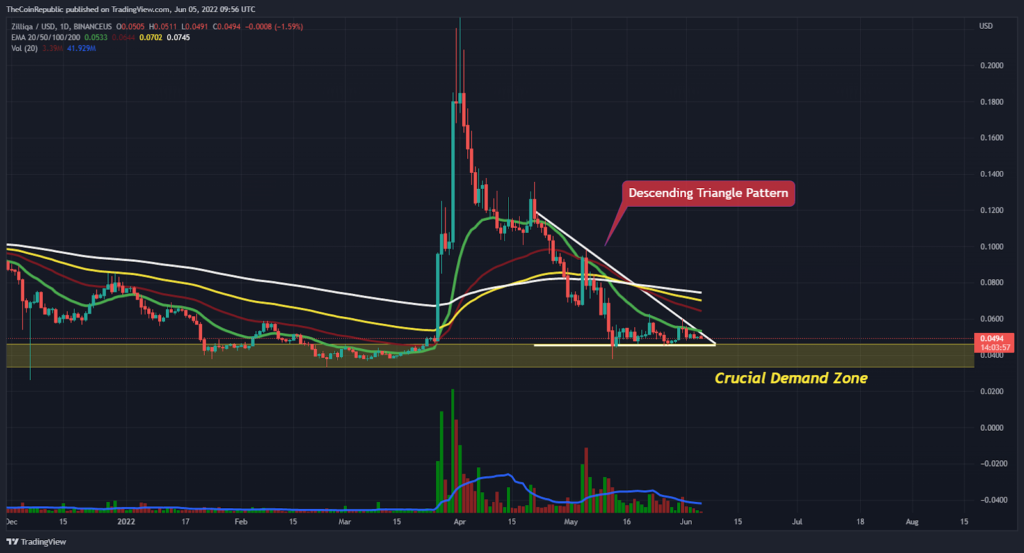
To regain the strong rising momentum on the daily chart, the ZIL coin price must maintain its present level. These are the ramifications of the current bear market. The entire cryptocurrency market is at an all-time low, and each altcoin is rallying to reclaim the uptrend’s momentum. To break out of the declining triangle pattern, the ZIL coin has to attract more buyers. However, volume change can be observed below average and needs to grow for ZIL to escape the pattern.
ZIL Bulls sustain or get Detained?
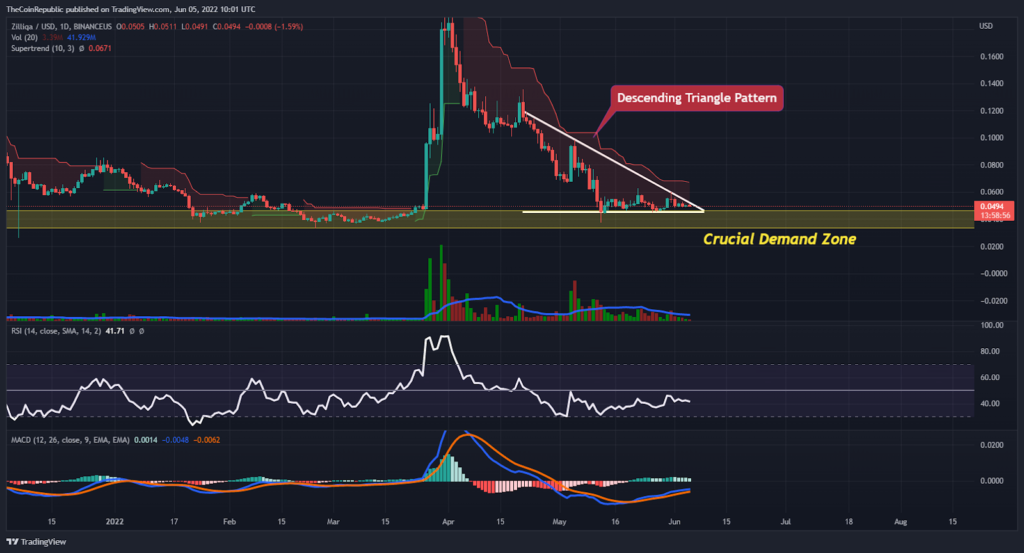
ZIL coin price is trading inside a descending triangle pattern over the daily chart. The token is trying to gain steady uptrend momentum but falters at the current level. ZIL coin’s technical indicators point to a long-term bearish trend. Furthermore, the ZIL coin’s bearish momentum is confirmed by the supertrend on the daily chart. The Relative Strength Index shows that ZIL has been trading below neutrality for a long time and is now struggling to maintain rising momentum.
Within the descending triangle pattern, MACD shows the ZIL coin’s consolidation phase. With a smaller margin, the MACD line is ahead of the signal line. ZIL investors should keep an eye on the daily chart for any directional changes.
សន្និដ្ឋាន
Zilliqa’s price got stuck inside a descending triangle pattern over the daily chart. The token is trying to gather the attention of bulls and falters to adapt to the uptrend momentum over the chart. ZIL coin’s technical indicators point to a long-term bearish trend. Furthermore, the ZIL coin’s bearish momentum is confirmed by the supertrend on the daily chart. ZIL investors should keep an eye on the daily chart for any directional changes.
កំរិតបច្ចេកទេស
កំរិតគាំទ្រ៖ ០,៤០ ដុល្លារ
កំរិតតស៊ូ: ០.០៥៣ ដុល្លារ
ការមិនទទួលខុសត្រូវ
ទស្សនៈ និងគំនិតដែលសរសេរដោយអ្នកនិពន្ធ ឬមនុស្សណាម្នាក់ដែលមានឈ្មោះក្នុងអត្ថបទនេះគឺសម្រាប់តែគំនិតព័ត៌មានប៉ុណ្ណោះ ហើយពួកគេមិនបង្កើតហិរញ្ញវត្ថុ ការវិនិយោគ ឬដំបូន្មានផ្សេងទៀតទេ។ ការវិនិយោគលើ ឬជួញដូរទ្រព្យសកម្មគ្រីបតូមកជាមួយហានិភ័យនៃការបាត់បង់ហិរញ្ញវត្ថុ។
Source: https://www.thecoinrepublic.com/2022/06/05/zilliqa-price-analysis-any-zeal-left-in-the-zil-token/