While the long-term chainlink (LINK) price direction is bullish, the direction of the short-term trend could be determined by whether LINK breaks out or gets rejected from the $6.96 area.
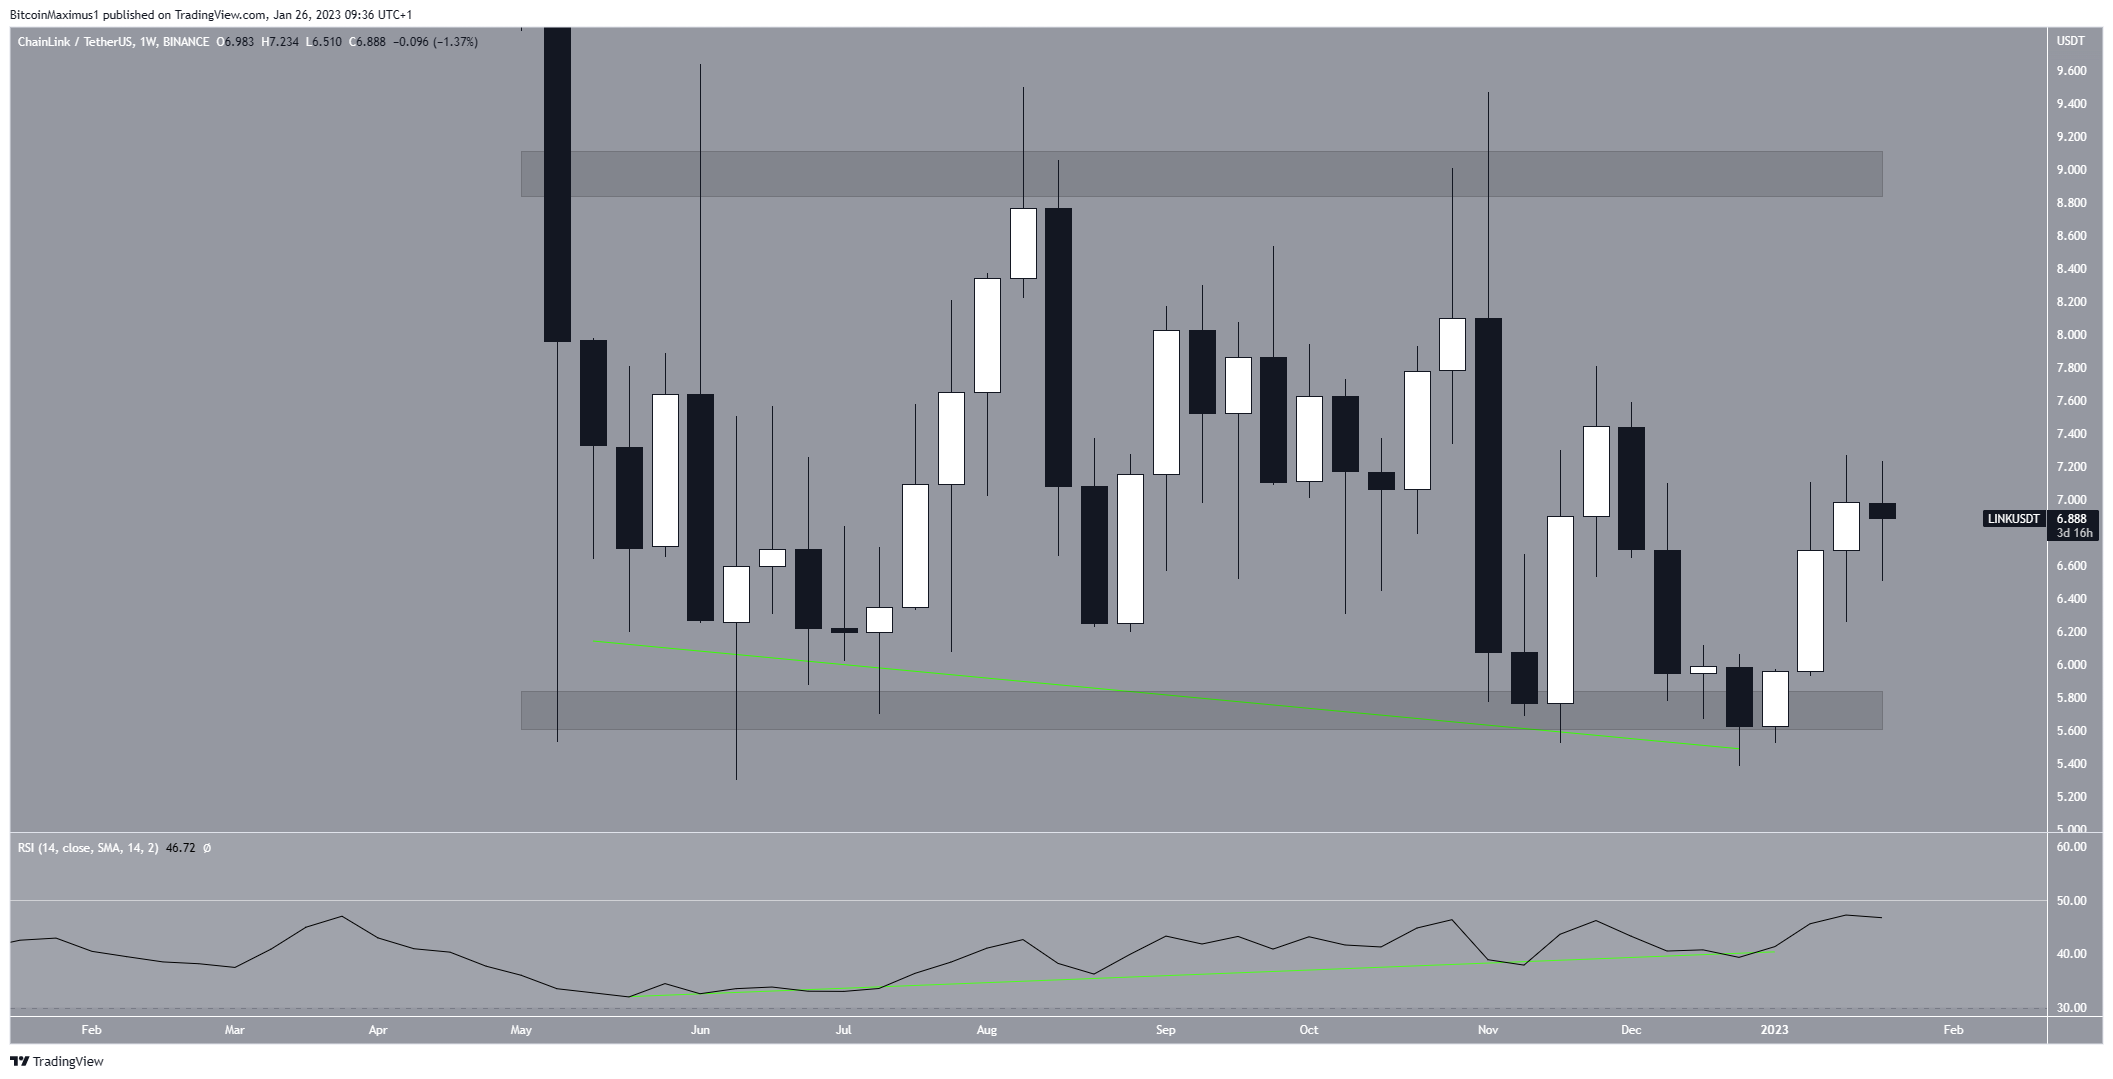
Since May 2022, the Chainlink តម្លៃ has traded above the $5.75 horizontal support area. While it reached a minimum price of $5.30, the LINK price managed to hold on above the $5.75 support area in the weekly time frame.
During this entire period, the weekly ខ្សែ RSI generated bullish divergence (green line). Divergence in such a high time frame is rare and often precedes significant bullish trend reversals.
If the upward movement continues, the next resistance area would be at $9. The price has not reached a close above this level since May 2022. If it does, the rate of increase could accelerate further toward the next resistance at $18.

On the other hand, a weekly close below $5.75 would mean that the trend is still bearish. In that case, the LINK price could fall toward $4.
Due to the bullish divergence, a breakout is more likely.
Chainlink Price Prediction for Feb: Eventual Breakout Likely
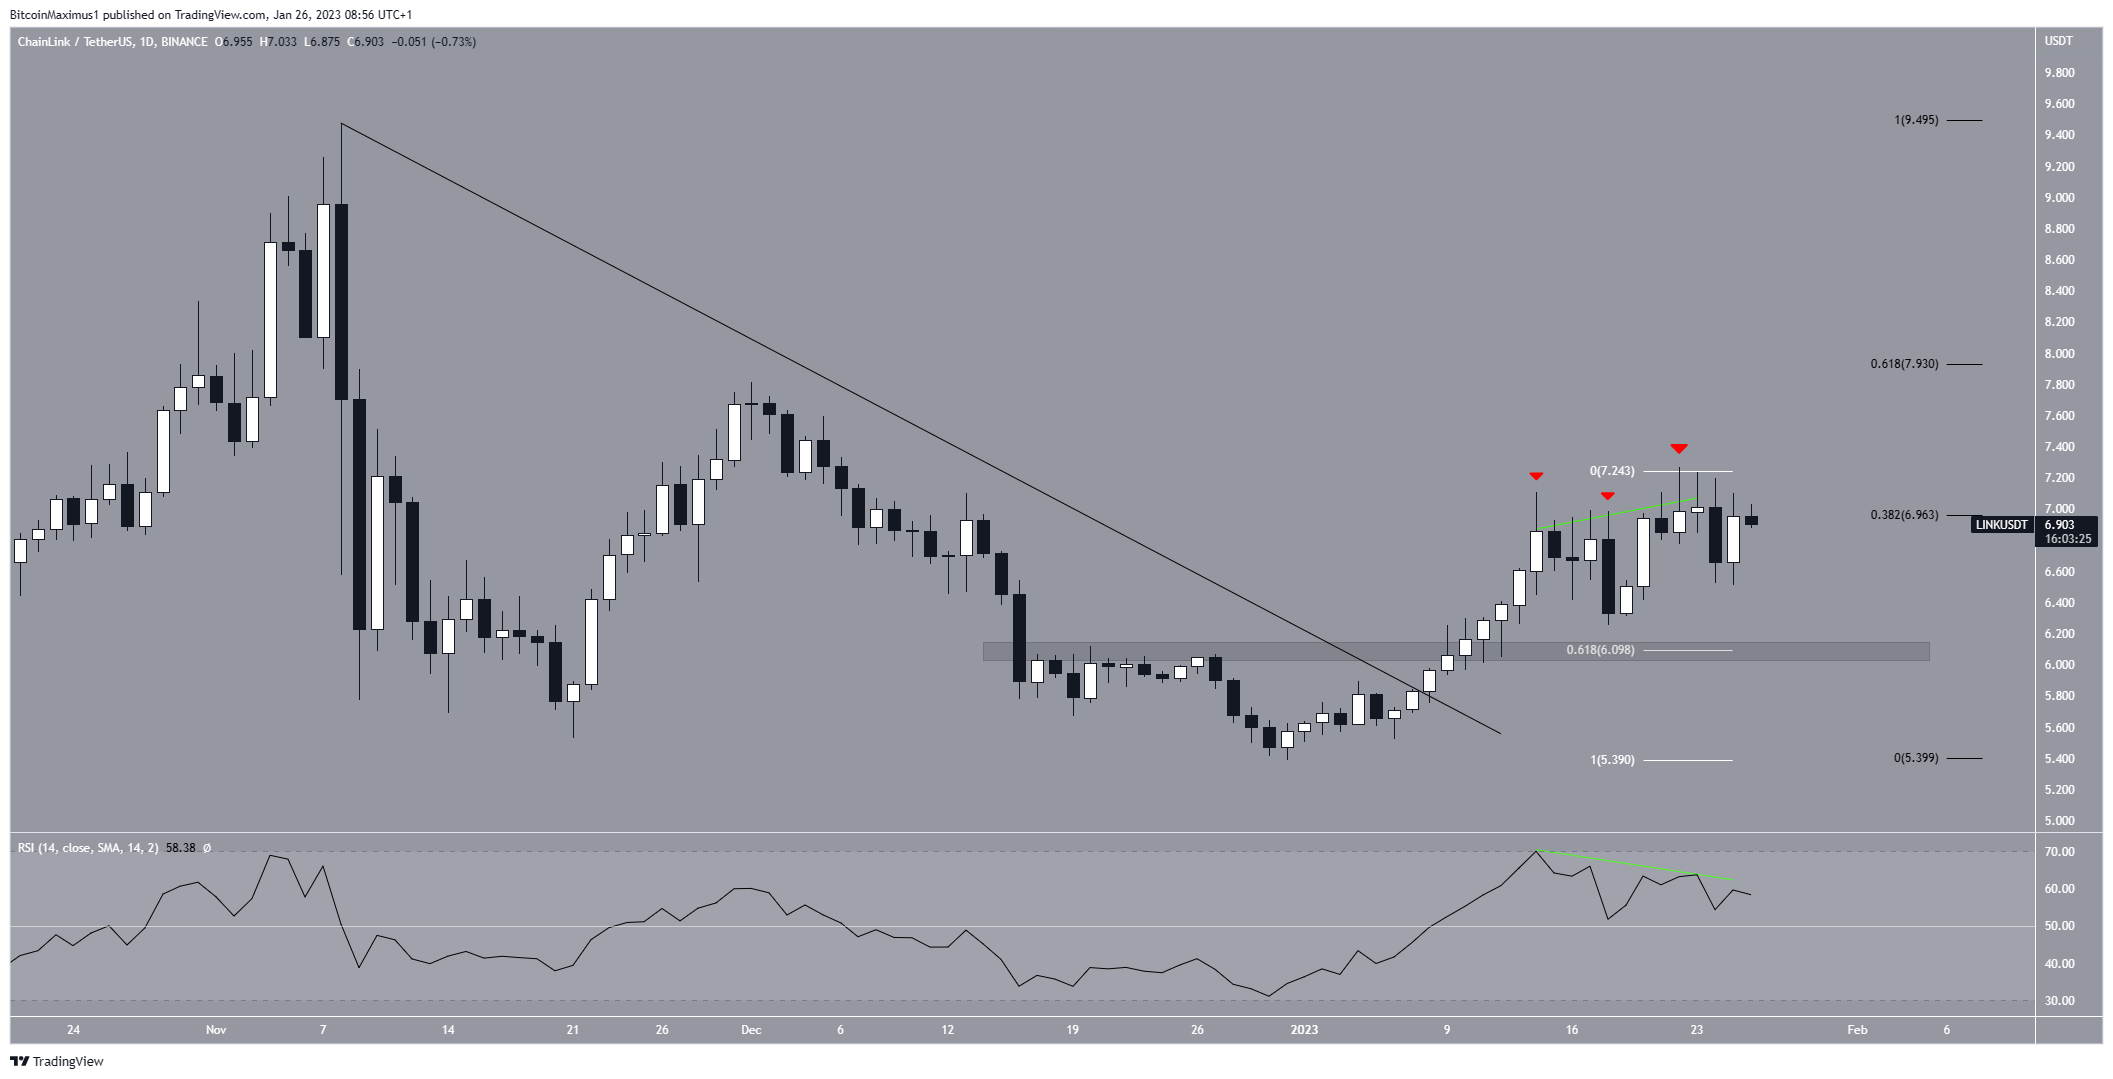
The technical analysis from the daily time frame shows that the Chainlink price broke out from a descending resistance line on Jan. 8, initiating the current increase.
Currently, the LINK token is attempting to break out from the 0.382 Fib retracement resistance level at $6.96. So far, it has made three unsuccessful attempts at doing so (red icons), which have been combined with bearish divergence on the RSI (green line).
If a breakout occurs, it will bode well for the future price, likely leading to an increase toward the 0.618 Fib retracement resistance level at $7.93. Conversely, a rejection could lead to a fall toward the closest support area at an average price of $6.10. The 0.618 Fib retracement support level and a horizontal support area create the support area.
The short-term six-hour time frame shows that the Chainlink price completed a five-wave upward movement and is now correcting inside an A-B-C corrective structure (black). As a result, it supports the possibility that the LINK price will continue to decrease in the next 24 hours, reaching a bottom at the 0.5-0.618 Fib retracement support levels at $6.11-$6.33.
Afterward, the upward movement will continue, providing a bullish Chainlink price prediction for Feb.
An increase above the current highest price of $7.27 would mean that the retracement is complete, likely leading to highs near the 0.618 Fib retracement resistance level at $7.93.
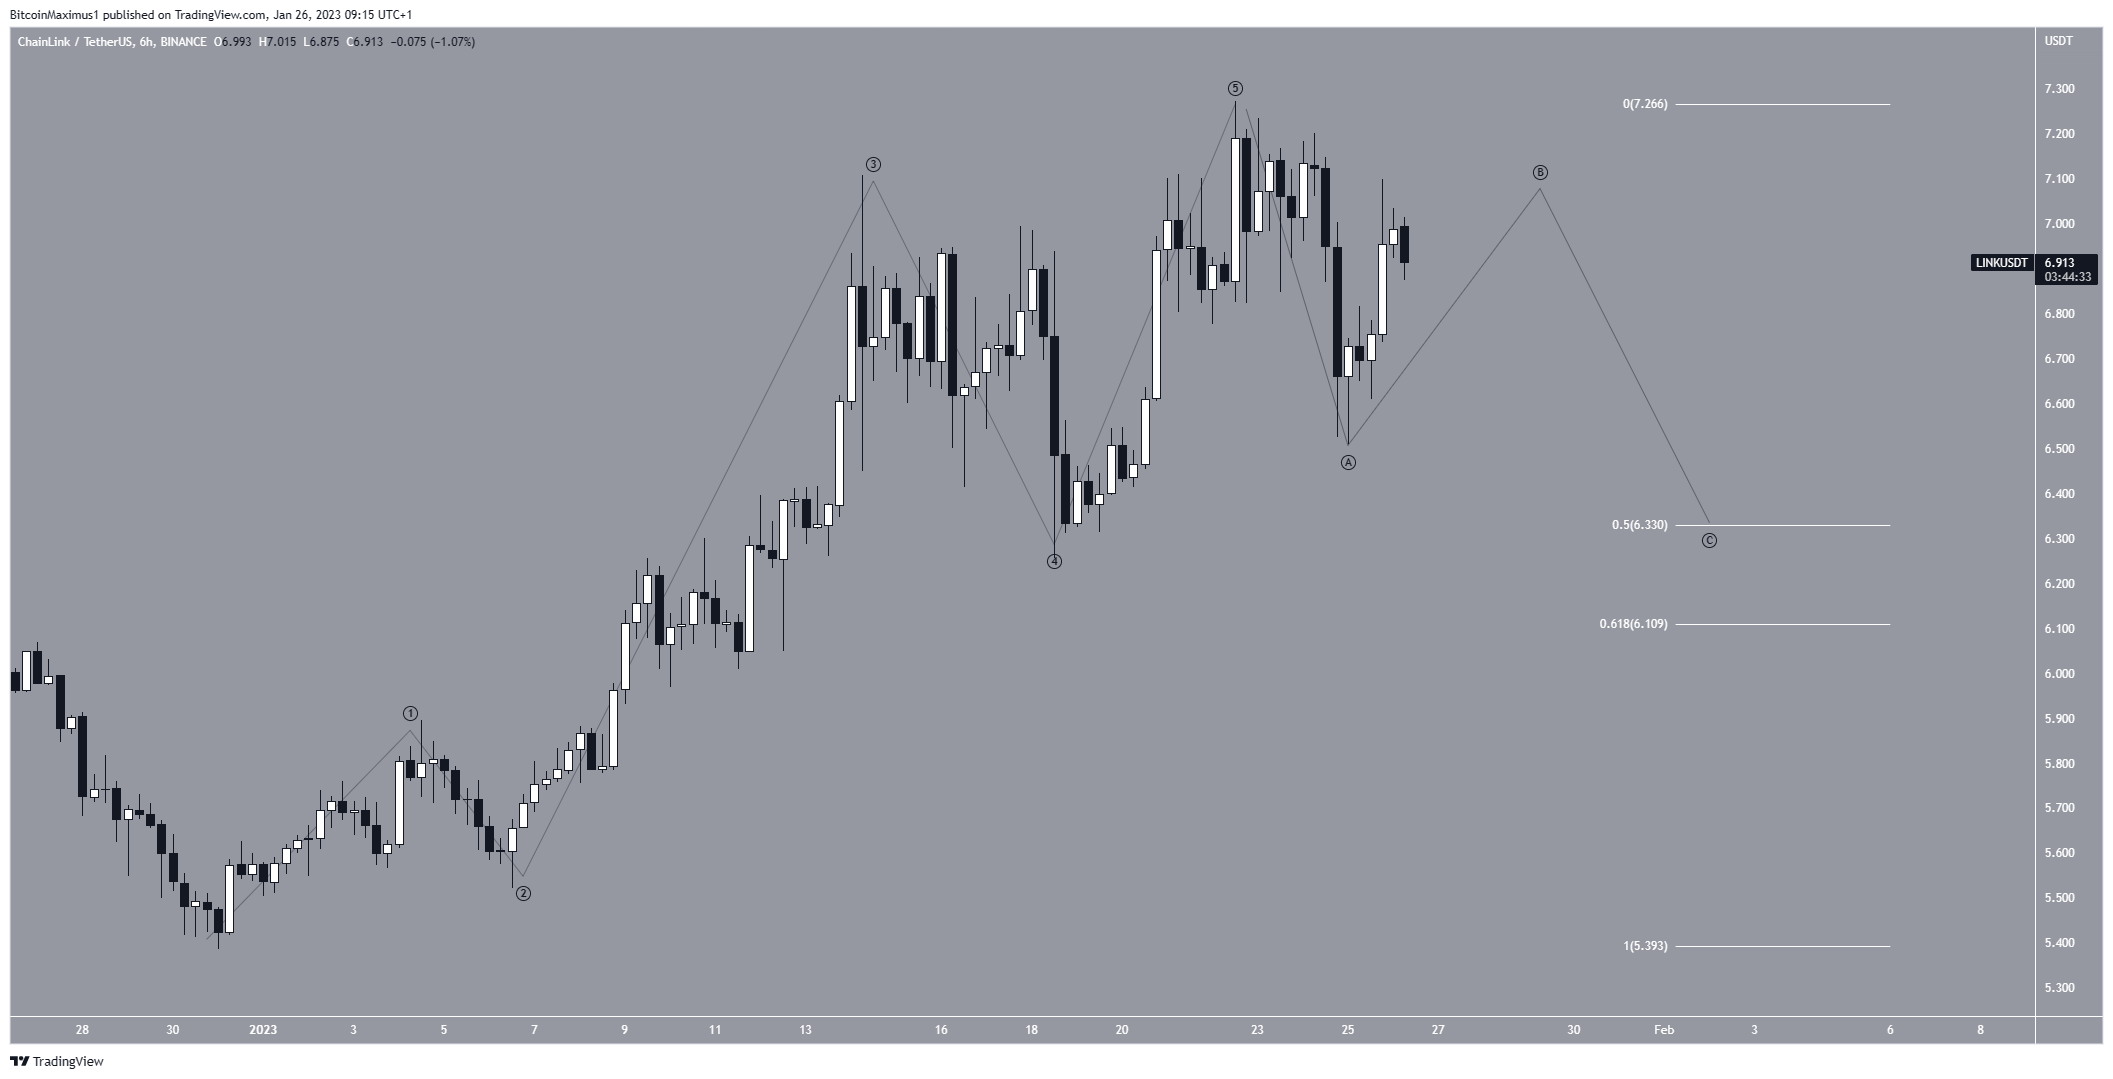
To conclude, the most likely Chainlink price forecast is a drop toward the $6.10-$6.33 area followed by a massive upward movement. A short-term increase above $7.27 would indicate that the drop will not occur, rather that the LINK price will immediately increase.
សម្រាប់ការវិភាគទីផ្សារគ្រីបតូចុងក្រោយបង្អស់របស់ BeInCrypto ចុចទីនេះ។
ការមិនទទួលខុសត្រូវ
BeInCrypto ខិតខំផ្តល់ព័ត៌មានត្រឹមត្រូវ និងទាន់សម័យ ប៉ុន្តែវានឹងមិនទទួលខុសត្រូវចំពោះការពិតដែលបាត់ ឬព័ត៌មានមិនត្រឹមត្រូវណាមួយឡើយ។ អ្នកគោរពតាម និងយល់ថាអ្នកគួរតែប្រើព័ត៌មាននេះដោយហានិភ័យផ្ទាល់ខ្លួនរបស់អ្នក។ Cryptocurrencies គឺជាទ្រព្យសកម្មហិរញ្ញវត្ថុដែលមានការប្រែប្រួលខ្លាំង ដូច្នេះត្រូវស្រាវជ្រាវ និងធ្វើការសម្រេចចិត្តផ្នែកហិរញ្ញវត្ថុផ្ទាល់ខ្លួនរបស់អ្នក។
Source: https://beincrypto.com/chainlink-link-price-prediction-feb-9-expected/