នេះ Litecoin (LTC) price made an attempt at breaking out from the $72.50 resistance area on Dec. 26 but was rejected. Due to the confluence of multiple resistance levels, this is a crucial area for the future trend.
Litecoin was created by Charlie Lee on Oct. 7, 2011. The Litecoin network went live on Oct. 12 of the same year. The cryptocurrency is very similar to Bitcoin since it was based on its protocol, but it is designed to provide faster transactions.
The Litecoin price recovered admirably since its June 2022 lows and is currently trading 72% above them. However, the trend’s direction is still unclear.
Litecoin Price Makes Breakout Attempt
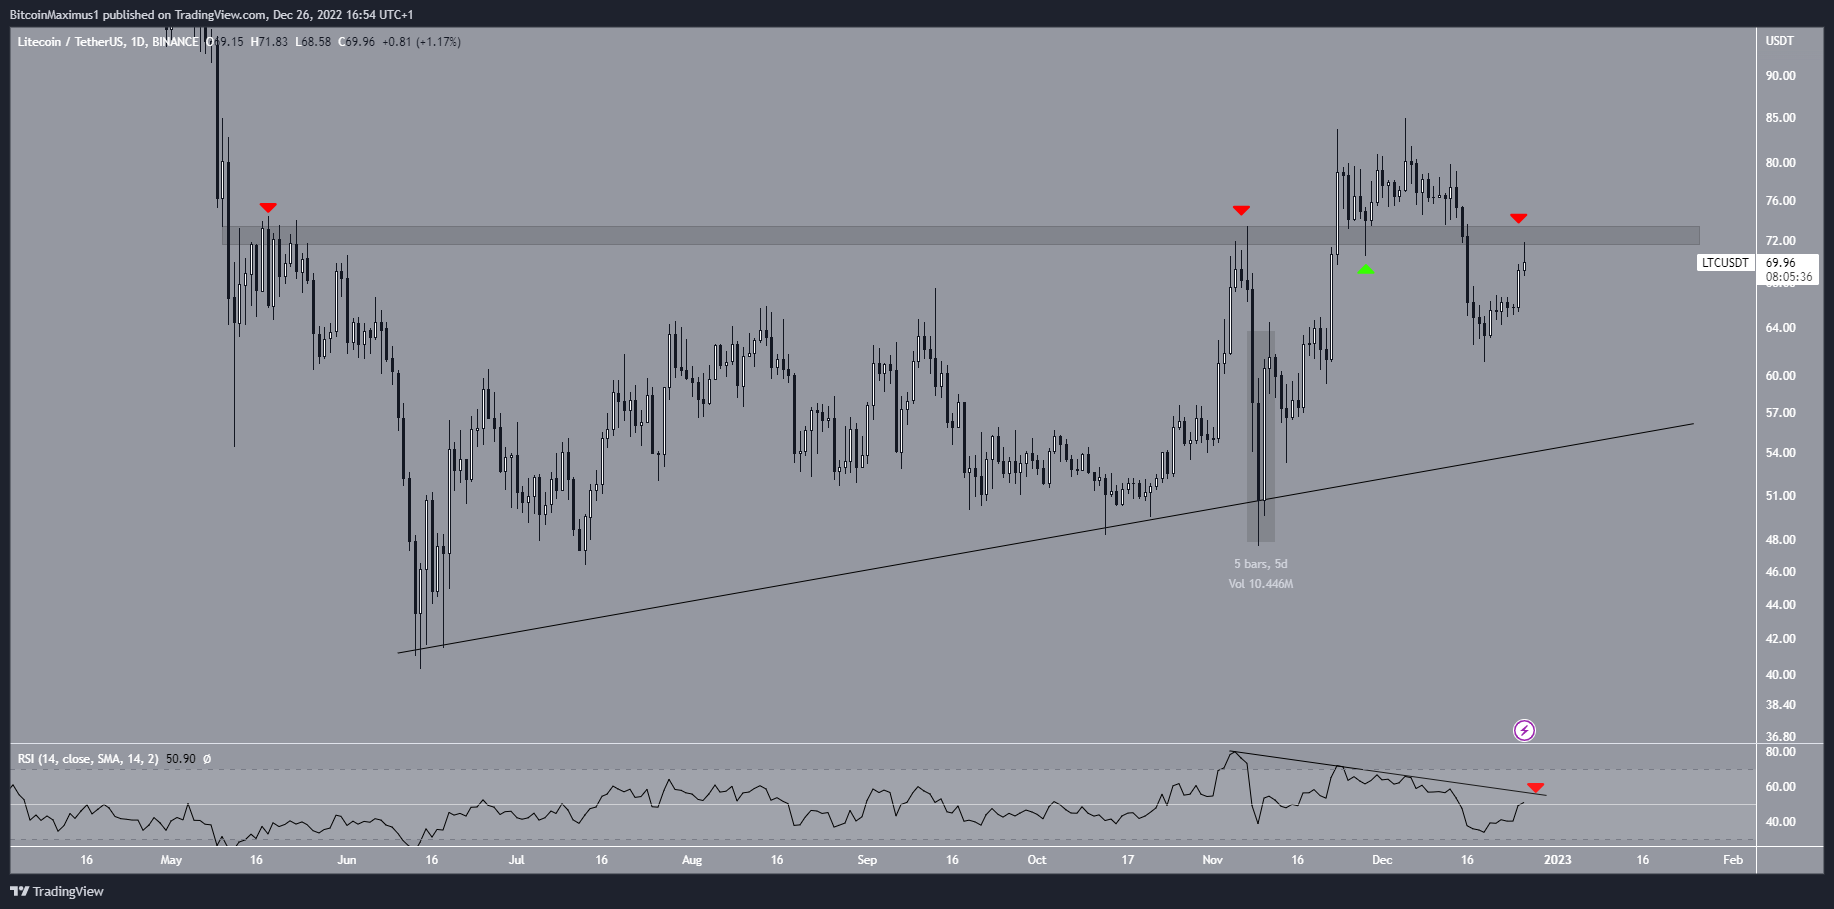
Litecoin តម្លៃ has increased alongside an ascending support line since June 10. The line was validated numerous times, most recently on Nov. 9. After bouncing, the LTC price created a bullish engulfing candlestick (highlighted). This led to an upward movement that took the Litecoin price above the $72.50 resistance area. This was a crucial development since the area had previously been in place since May (red icons).

However, the Litecoin price failed to sustain its upward movement and fell below the resistance area shortly afterward. Now, the $72.50 area is expected to provide resistance once more.
ប្រចាំថ្ងៃ ខ្សែ RSI supports the legitimacy of the resistance area. The indicator is validating both the 50 line and a descending resistance line, which has been in place since the beginning of November.
Therefore, whether the Litecoin price reclaims the $72.50 area, also causing the RSI to break out will likely determine the direction of the future trend. Failure to do so could cause a drop toward the ascending support line that is currently at $57.
Short-Term Rejection
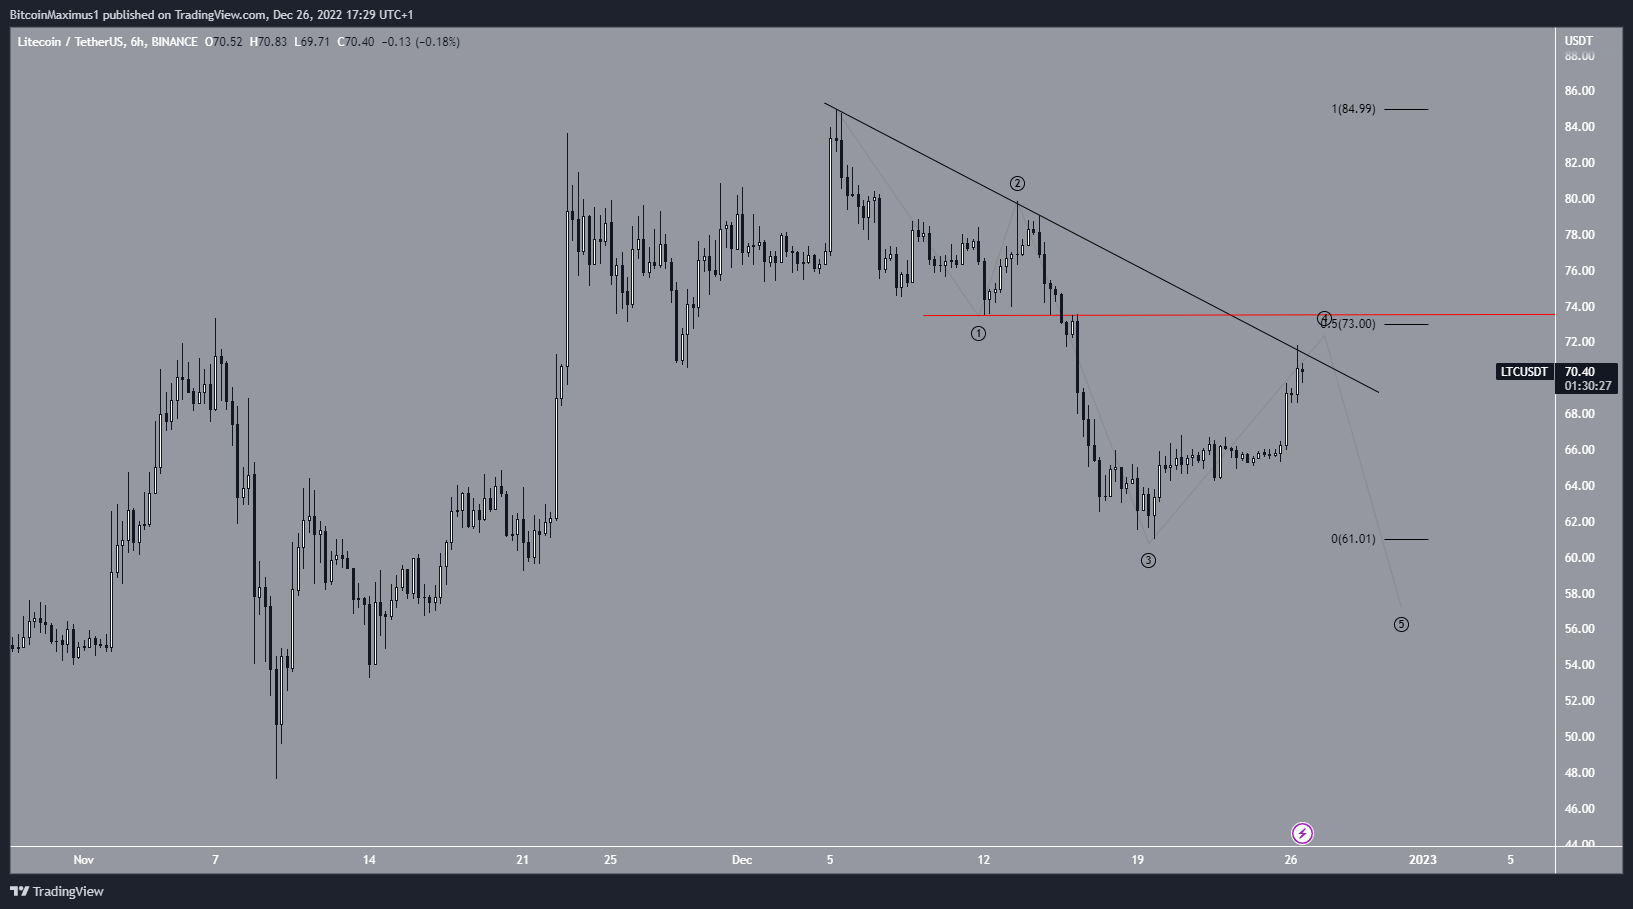
The six-hour chart further adds to the importance of the $72.50 resistance area, since the area also coincides with a short-term descending resistance line in place since Dec. 6 and is very close to the 0.5 Fib retracement resistance level. Therefore, the trend is considered bearish until the Litecoin price reclaims this area.
Moreover, the wave count has a key level at $73.49. A movement above it would invalidate the possibility that the decrease is a five-wave downward movement (black), hence confirming that it is a correction.
Therefore, whether the LTC price breaks out or gets rejected could determine the future trend. In case of the former, the Litecoin price would likely increase toward $100, while in case of the latter it would fall toward $57.
To conclude, future LTC price projection is still unclear. If the LTC price manages to move above $72.50, it would mean that the trend is bullish. On the other hand, if the Litecoin price gets rejected it would likely catalyze a fall toward $57.
សម្រាប់ការវិភាគទីផ្សារគ្រីបតូចុងក្រោយបង្អស់របស់ BeInCrypto ចុចទីនេះ។
ការមិនទទួលខុសត្រូវ
BeInCrypto ខិតខំផ្តល់ព័ត៌មានត្រឹមត្រូវ និងទាន់សម័យ ប៉ុន្តែវានឹងមិនទទួលខុសត្រូវចំពោះការពិតដែលបាត់ ឬព័ត៌មានមិនត្រឹមត្រូវណាមួយឡើយ។ អ្នកគោរពតាម និងយល់ថាអ្នកគួរតែប្រើព័ត៌មាននេះដោយហានិភ័យផ្ទាល់ខ្លួនរបស់អ្នក។ Cryptocurrencies គឺជាទ្រព្យសកម្មហិរញ្ញវត្ថុដែលមានការប្រែប្រួលខ្លាំង ដូច្នេះត្រូវស្រាវជ្រាវ និងធ្វើការសម្រេចចិត្តផ្នែកហិរញ្ញវត្ថុផ្ទាល់ខ្លួនរបស់អ្នក។
Source: https://beincrypto.com/litecoin-price-72-50-area-is-key-resistance/