Litecoin Price Increases in Rallying motion– March 30
It is still apparent that the LTC/USD market activities still hold values at a higher resistance as the crypto-economic price increases in rallying motion. The crypto economy is around $131 between the high and the low of $133 and $126, keeping a minimal positive percentage rate of 0.95.
Price Increases in Rallying motion: LTC Trade
កម្រិតគន្លឹះ:
កម្រិត Resistance: ០,១៩ ដុល្លារ, ០,២០ ដុល្លារ, ០,២១ ដុល្លារ
កំរិតគាំទ្រ៖ ០,១១ ដុល្លារ, ០,១០ ដុល្លារ, ០,០០៩ ដុល្លារ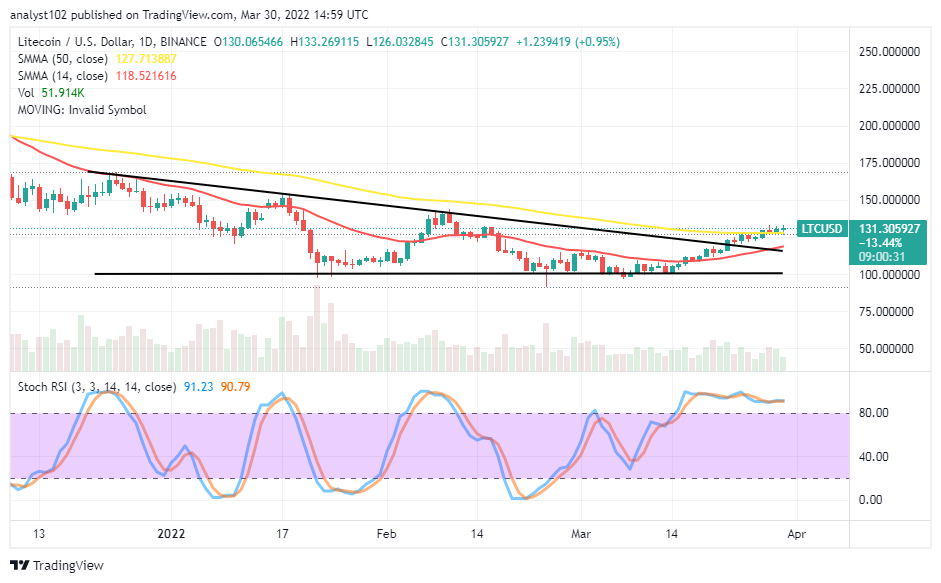
LTC / ដុល្លារ - គំនូសតាងប្រចាំថ្ងៃ
The LTC/USD daily chart shows the crypto-economic price increases in rallying motion toward the north. The 14-day SMA indicator slightly curves toward the north beneath the 50-day SMA indicator. Smaller candlesticks are continually featuring slightly over the bigger SMA trend line. The Stochastic Oscillators are in the overbought region, moving in a consolidation manner to depict that a force to the upside is still in progress.
Is it safe to start shorting positions in the LTC/USD market as price increases in rallying motion?
It is still somewhat that the LTC/USD market sellers are gathering momentum until the present as the crypto-economic price increases in rallying motion. Long-position takers have been careful to either pause or to continue pushing in the way of rallying motion around a higher level of $130. From the technical point of view, it is not ideal to go for more opening of new long orders.
On the downside of the technical analysis, the LTC/USD market short-position takers are to be on the lookout for price rejections around a higher resistance trading level. Some barriers are piling up as price holds, increase for rallying motion around the 50-day SMA trend line. It likely price downsizes in value while it cannot hold firmly above the $135 resistance level in the long run.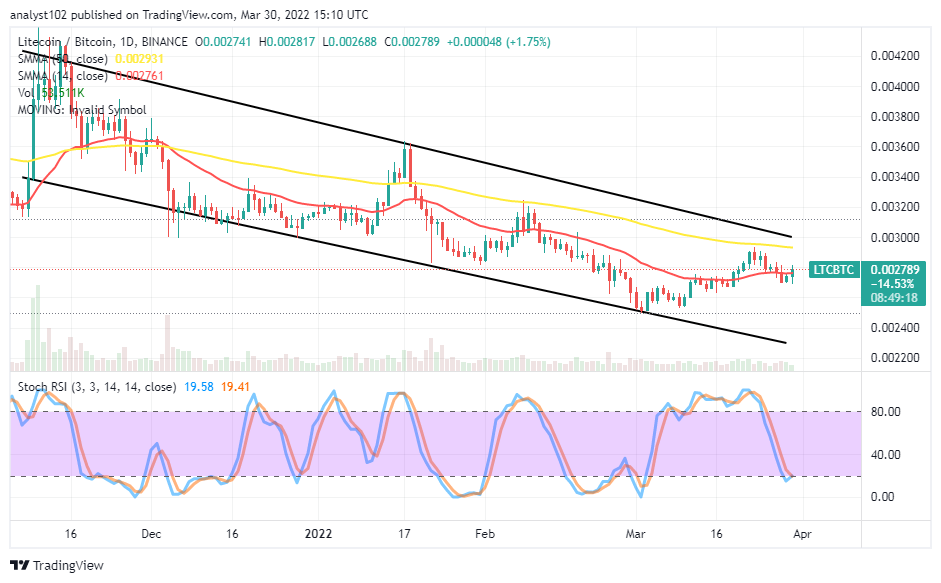
ការវិភាគតម្លៃ LTC / BTC
In comparison, Litecoin, as the base cryptocurrency, is now striving to regain its stance against Bitcoin. Lately, the counter crypto exerted a force on the base crypto as the price went down, back to trade around the trend line of the smaller SMA. The 50-day SMA trend line is above the 14-day SMA trend line. The Stochastic Oscillators are down closely at the range of 20, trying to close the lines around the range line. A chain of bullish candlesticks is in the making, signifying the base crypto may attempt to push northward back soon.
កំពុងរកមើលដើម្បីទិញឬធ្វើពាណិជ្ជកម្ម Bitcoin (ប៊ីស៊ីធី) ឥឡូវនេះ? វិនិយោគនៅអ៊ីតូរ៉ូ!

គណនីវិនិយោគិនលក់រាយរបស់ 68% បាត់បង់លុយនៅពេលធ្វើការជួញដូរ CFD ជាមួយអ្នកផ្តល់សេវាកម្មនេះ។
អានបន្ថែម:
Source: https://insidebitcoins.com/news/litecoin-price-prediction-ltc-usd-price-increases-in-rallying-motion