ការបដិសេធ៖ ព័ត៌មានដែលបានបង្ហាញមិនបង្កើតជាហិរញ្ញវត្ថុ ការវិនិយោគ ការជួញដូរ ឬប្រភេទផ្សេងទៀតនៃដំបូន្មានទេ ហើយគ្រាន់តែជាគំនិតរបស់អ្នកនិពន្ធតែប៉ុណ្ណោះ
- The daily market structure, at press time, was about to flip bullish
- Two levels for lower timeframe traders to watch out for as a retest can provide trading opportunities
The release of the CPI data was just around the corner, at the time of writing. Ease in inflation is expected, but is this expectation already priced in? Does that explain the recent Bitcoin pump right into a zone of resistance at this critical moment? And, what can that mean for Polkadot traders?
អានការព្យាករណ៍តម្លៃ 2023-24 របស់ Polkadot
Traders can prepare themselves for the bullish and the bearish scenarios. Since DOT is also at a critical inflection point, its next leg is not yet certain. Evidence for the next move can be awaited before assuming positions in the market.

The daily bearish breaker is likely to oppose DOT bulls
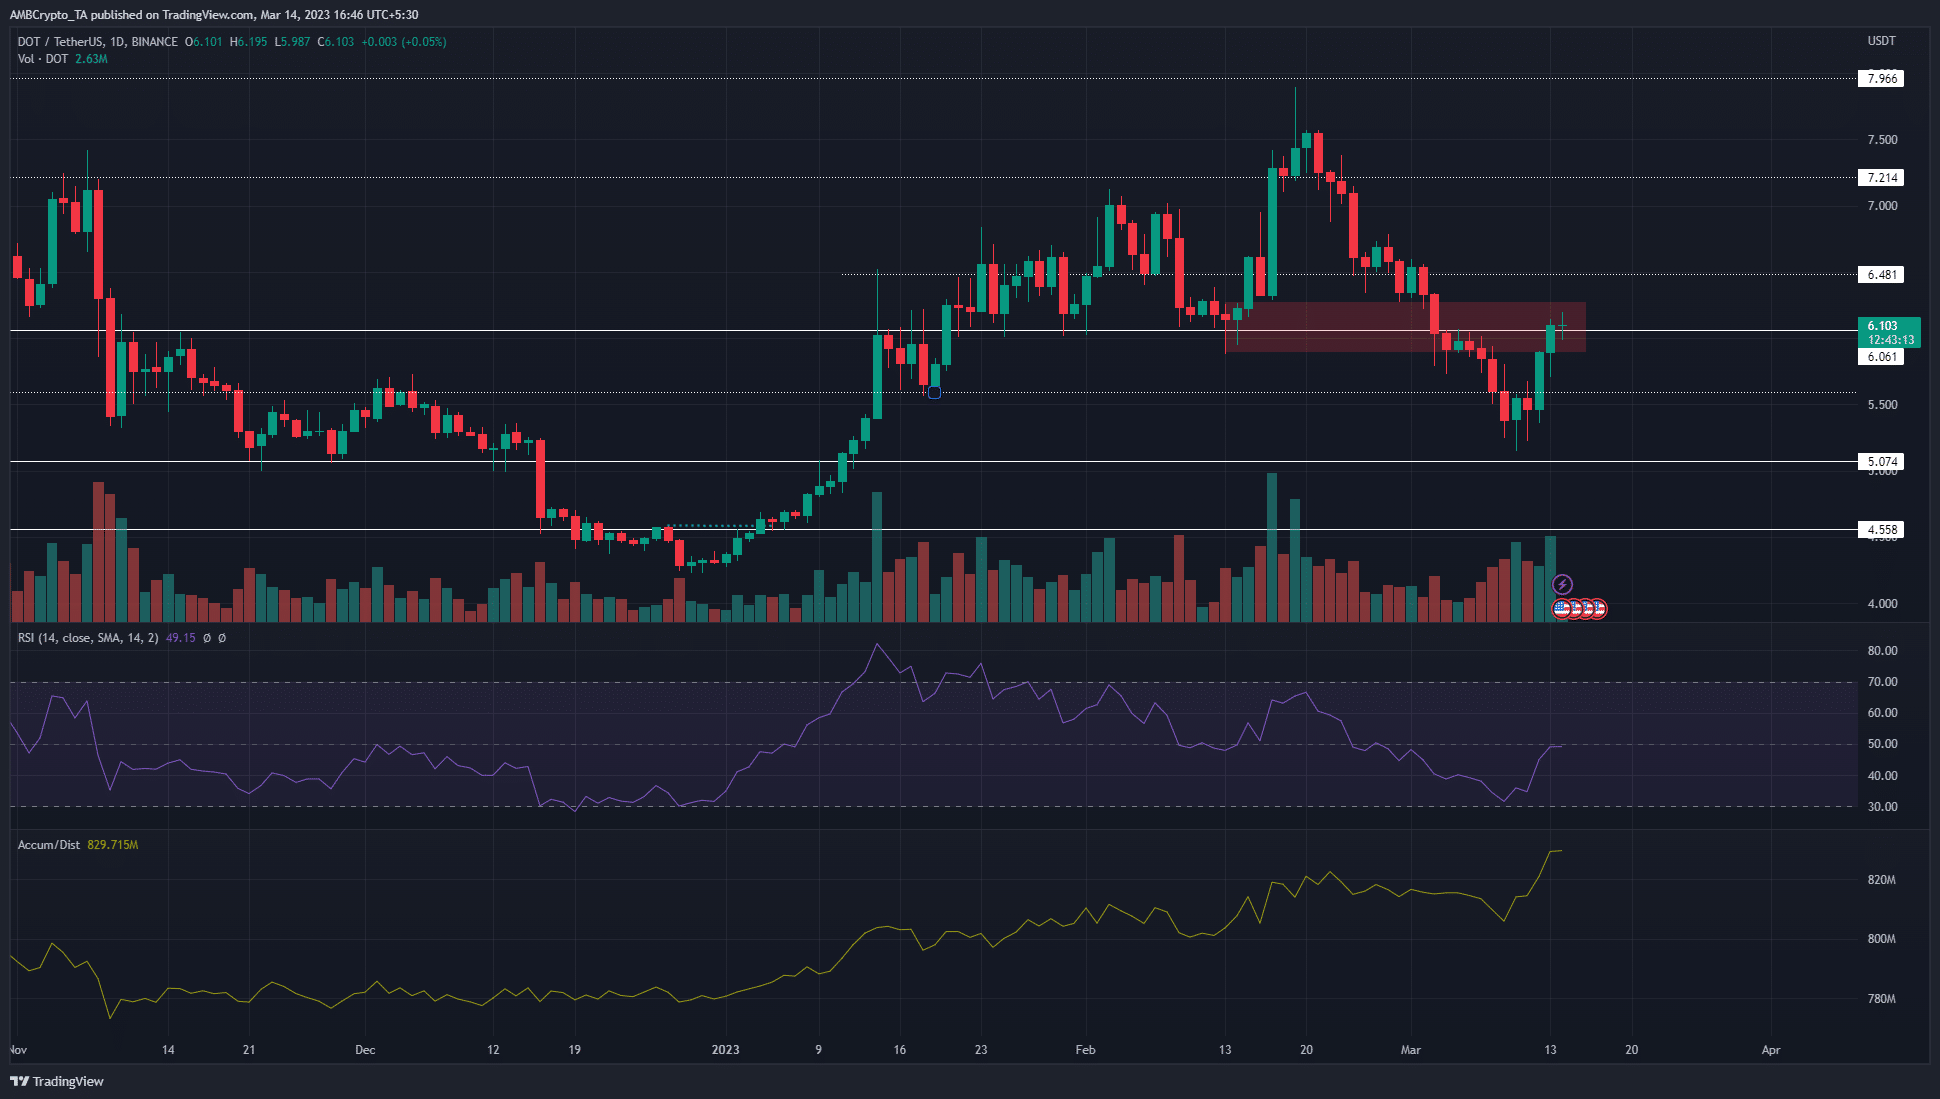
ប្រភព៖ DOT / USDT ស្តីពី TradingView
A former bullish order block, which was flipped to a bearish breaker in early March, was highlighted by the red box. At the time of writing, the price was within this zone, testing it as a zone of supply. Moreover, this area had confluence with the $6.1-level of resistance. Bitcoin was trading just below the $25.2k resistance, which marked the highs of August 2022 and February.
If BTC can break out past this resistance, it would signal bullish sentiment across the market. This could prime DOT to climb past the $6.1-level as well. However, a daily session close above the breaker would be required before buyers can look for opportunities to enter long positions. The market structure was on the verge of flipping bullish as well, as the recent lower high at $6.06 from 5 March could be beaten.
On the other hand, if the price sees rejection and falls beneath the $5.75-level, it would be a sign that bears had taken control. Short sellers can thereafter look to short the asset, with a stop-loss above the $6.1-mark. To the south, targets would be the $5.6-level and the March low at $5.15.
តើ 1, 10, ឬ 100 DOT មានតម្លៃប៉ុន្មានថ្ងៃនេះ?
The RSI was at neutral 50 at press time, while the A/D line had climbed over the past few weeks to show strong buying pressure. This was another indication that DOT was in a significant area, but it appeared the buyers had an edge.
OI indicated participants could be trying to fade the rally
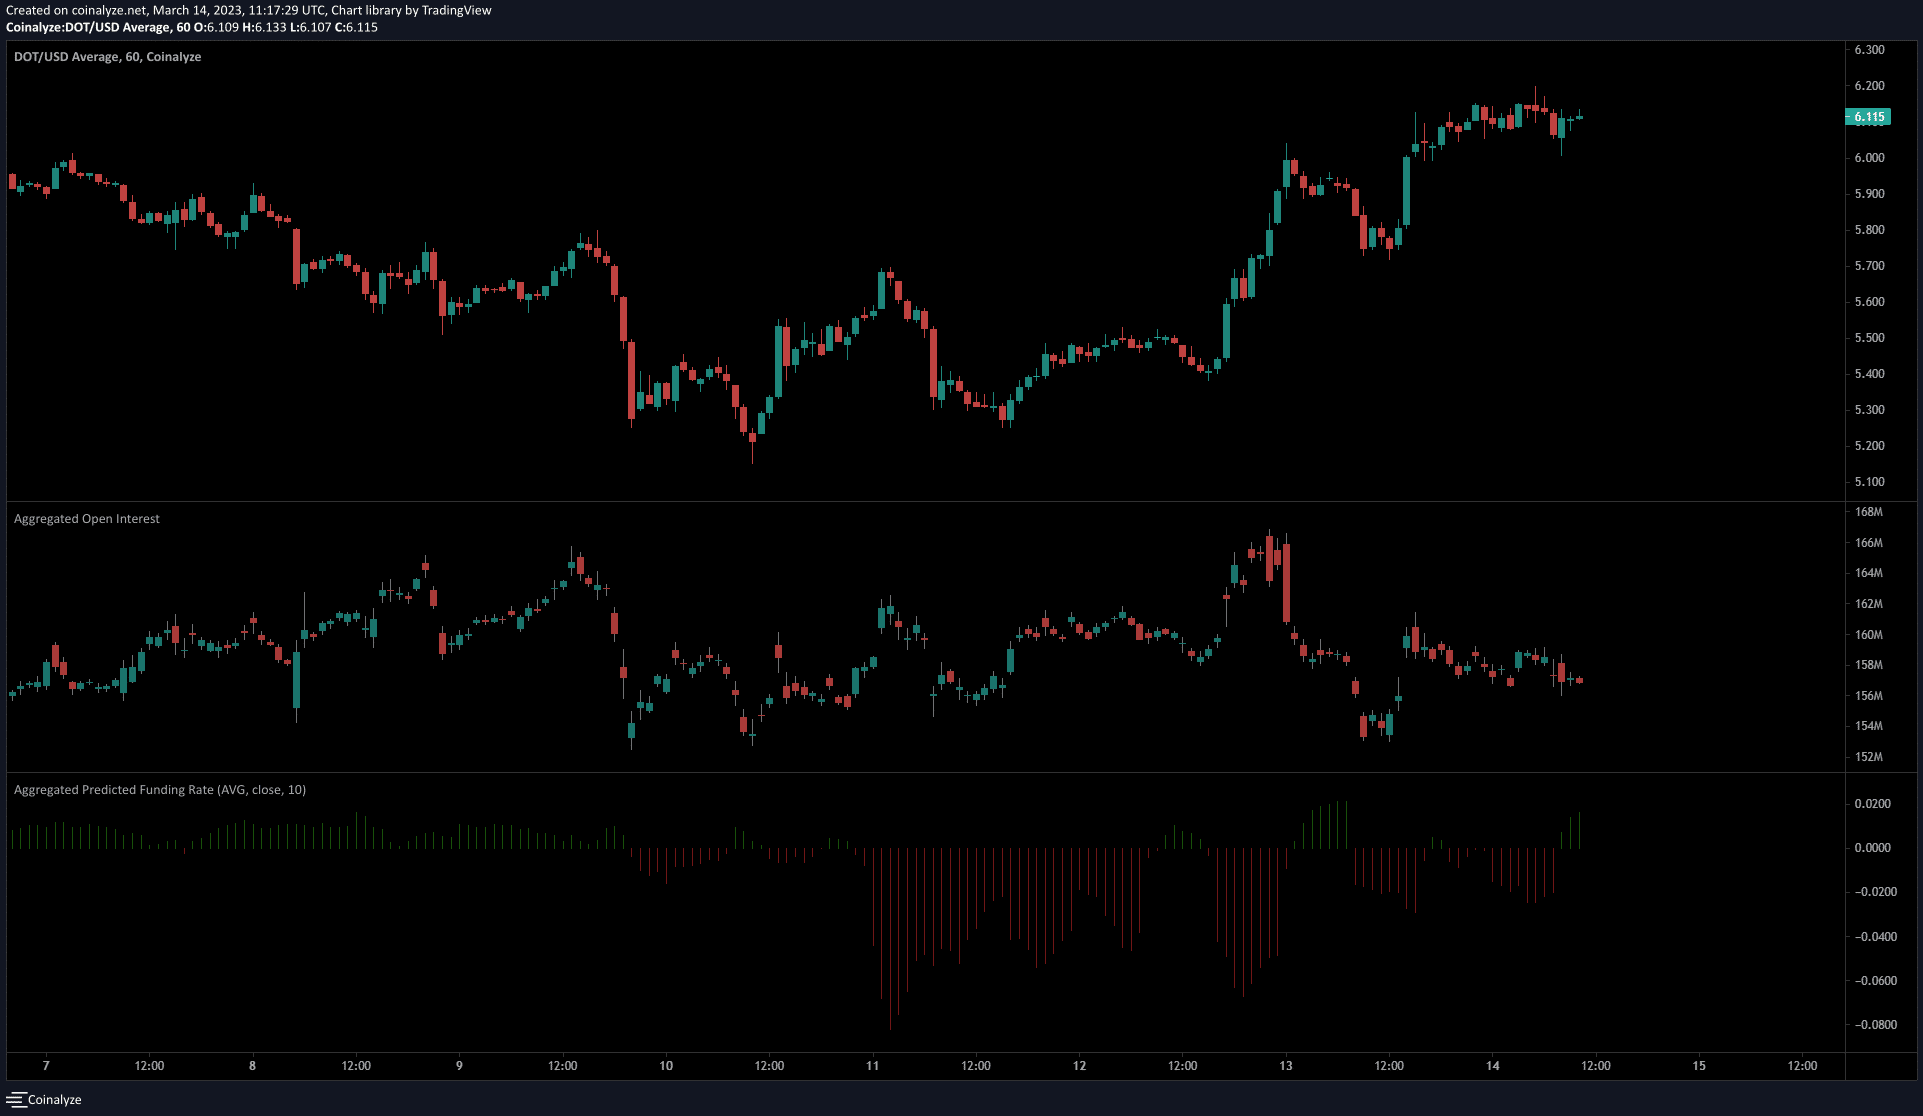
ប្រភព៖ Coinalyze
The Funding Rate jumped into positive territory to signal that the sentiment was bullish. However, the 1-hour chart showed a drop in Open Interest over the last 12 hours preceding the time of writing. In this period, the price continued to climb higher.
This suggested that long positions were discouraged and bearish sentiment began to take hold. And yet, it could be too early to short Polkadot. The reaction of Bitcoin over the next couple of days would show the direction of the market over the coming weeks.
Source: https://ambcrypto.com/polkadot-how-should-traders-navigate-dots-daily-bearish-breaker/