The price of Quant (QNT) has dropped significantly as it approaches the bottom of the chart.
Quant ការព្យាករណ៍តម្លៃរយៈពេលវែង៖ ធ្លាក់ចុះ
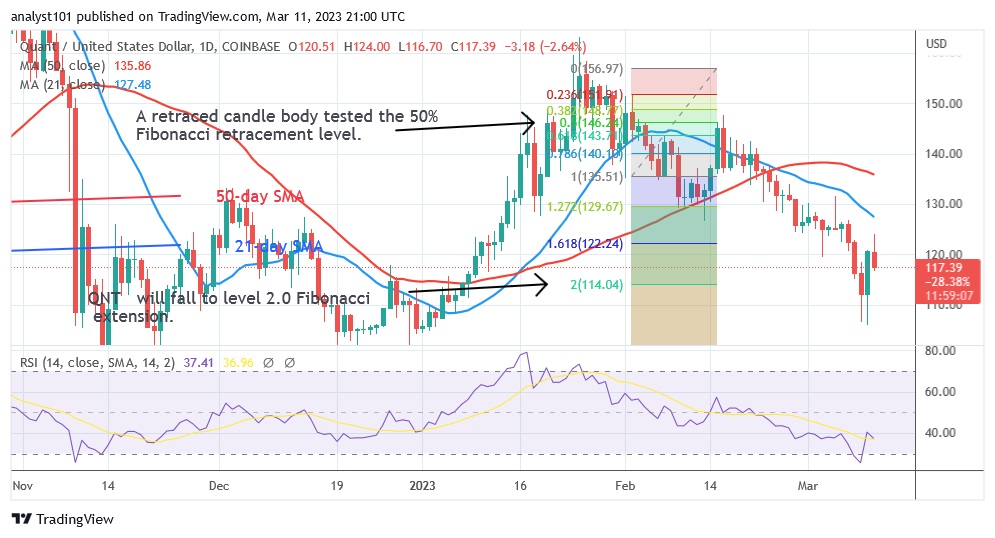
The cryptocurrency asset fell to a low of $106.54 as the bulls bought the dips. Although it rose in the correction, the altcoin was rejected at the high of $125. Selling pressure has increased once again as the altcoin moves back towards its current support. If QNT falls and breaks below the current support, the market will fall back to its lowest price point at $101, which is the downtrend. On the other hand, QNT will be forced to trade in a range between $106 and $130 if the current support holds. The moving average lines or resistance at $130.00 must be broken for the cryptocurrency to resume its uptrend. According to the price indicator, Quant has reached the necessary low of 2.0 Fibonacci extensions or $114.04. After the price decline on March 9, the altcoin temporarily fluctuated above the current support. The altcoin was oversold before the recent upward correction.
ការវិភាគសូចនាករតម្លៃ
QNT is in a downtrend at level 36 of the Relative Strength Index level 38 for the period 14. The altcoin can fall because it is in the downtrend zone. The cryptocurrency is declining because the price is still below the moving average lines. The daily stochastic is in a bearish momentum when it is below 80. QNT will reject the current support and reassess.

សូចនាករបច្ចេកទេស
តំបន់ផ្គត់ផ្គង់សំខាន់ៗ៖ $140, $150, $160
តំបន់តម្រូវការសំខាន់ៗ៖ $120, $110, $100
តើអ្វីជាការផ្លាស់ប្តូរបន្ទាប់សម្រាប់ Quant?
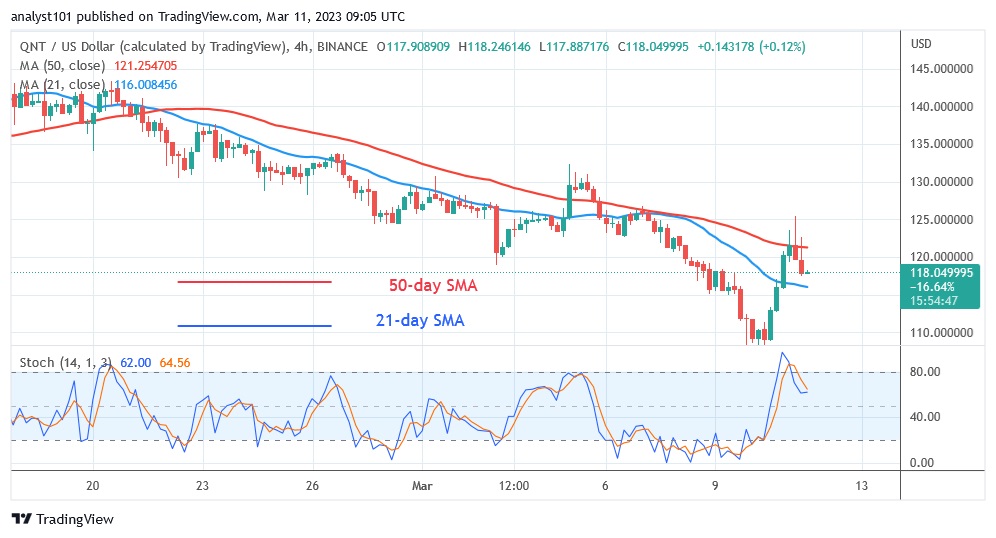
Quant will likely continue to decline. The 4-hour chart of the cryptocurrency showed a price rise above the moving average lines, which was stopped at a high of $125.00. After rejecting the recent high, QNT fell between the moving average lines. The altcoin will be forced to move in a range when the price bars are trapped between the moving average lines. Selling pressure will increase when the price falls below the moving average lines.

ការបដិសេធ។ ការវិភាគ និងការព្យាករណ៍នេះគឺជាគំនិតផ្ទាល់ខ្លួនរបស់អ្នកនិពន្ធ ហើយមិនមែនជាការណែនាំដើម្បីទិញ ឬលក់រូបិយប័ណ្ណគ្រីបតូ ហើយមិនគួរត្រូវបានចាត់ទុកថាជាការយល់ព្រមដោយ CoinIdol នោះទេ។ អ្នកអានគួរតែធ្វើការស្រាវជ្រាវដោយខ្លួនឯងមុនពេលវិនិយោគលើមូលនិធិ។
Source: https://coinidol.com/quant-falls-106/

