The Quant (QNT) តម្លៃ is hovering above long-term support at $105 and could begin a relief rally.
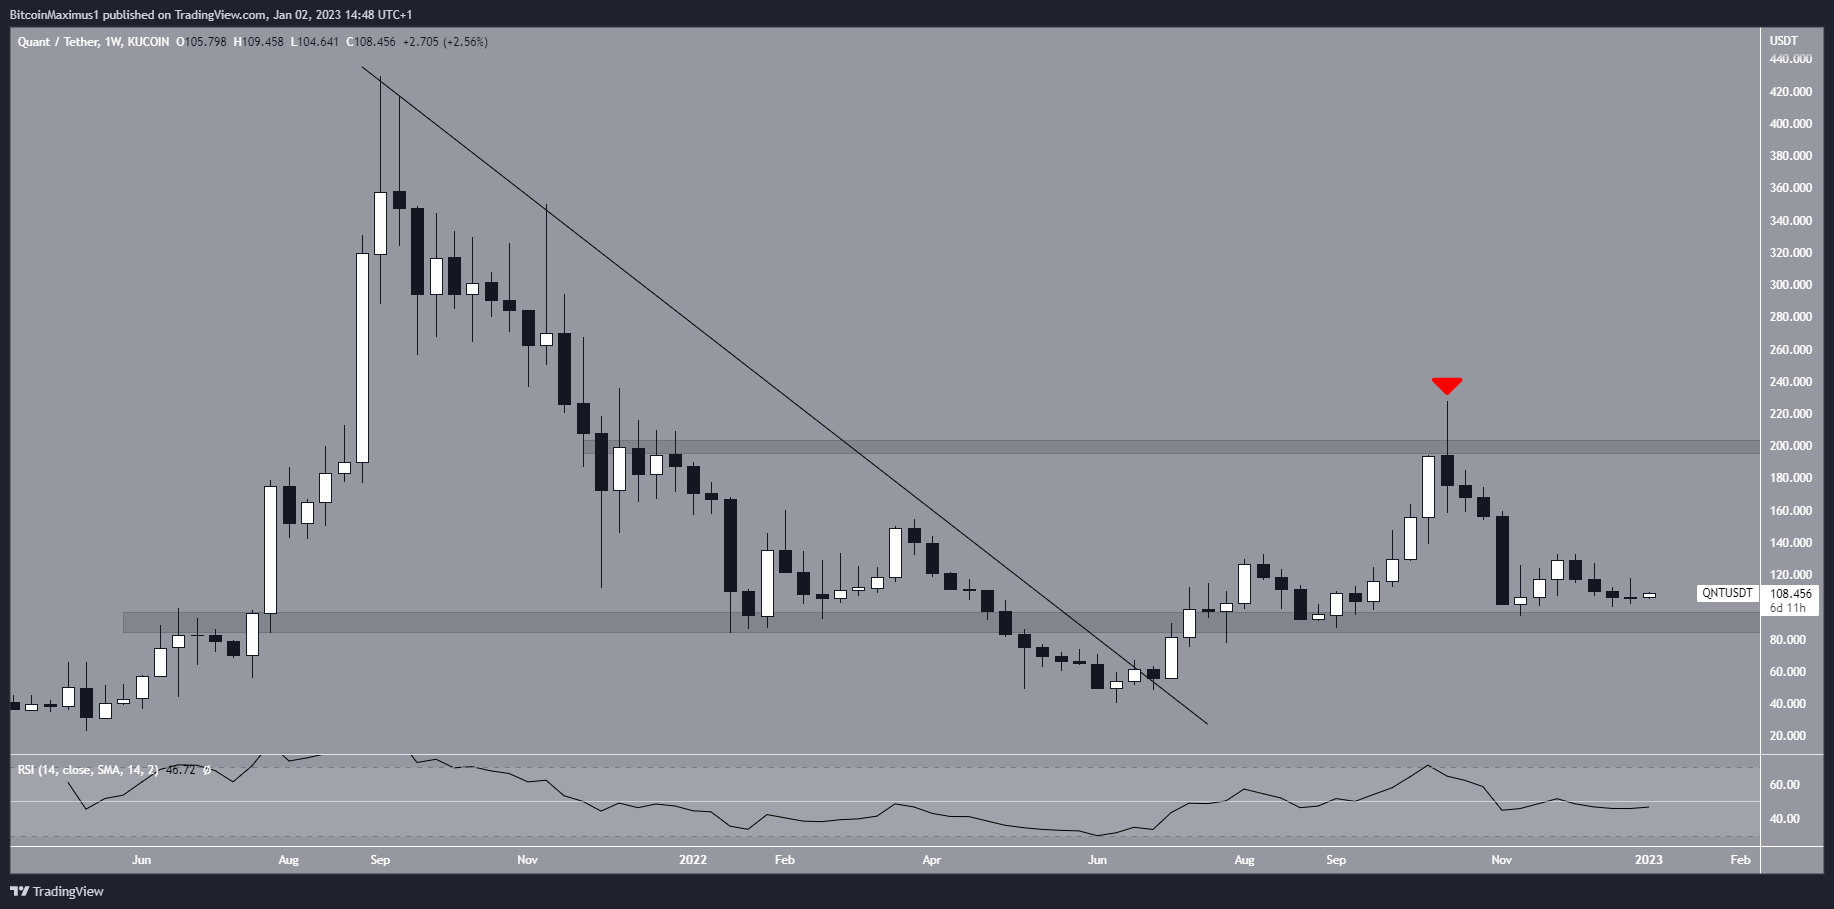
At the end of June, the QNT price broke out from a long-term descending resistance line, which had been in place since the all-time high of $429.69. Unsurprisingly, the breakout led to a sharp Quant upward movement and a maximum price of $228 in Oct. (red icon).
However, the price failed to reach a close above the $200 horizontal resistance area, even though it initially increased way above it.
The QNT price has nearly returned to the $90 support area. Therefore, it is trading inside a long-term range between $90 and $200 without a clear direction in its price movement.

លើសពីនេះទៅទៀត ប្រចាំសប្តាហ៍ ខ្សែ RSI is very close to the 50 line, a sign of a neutral trend.
Therefore, the weekly time frame is insufficient in giving a decisive direction for the QNT price analysis.
Quant Price Prediction For Jan: Relief Rally Incoming?
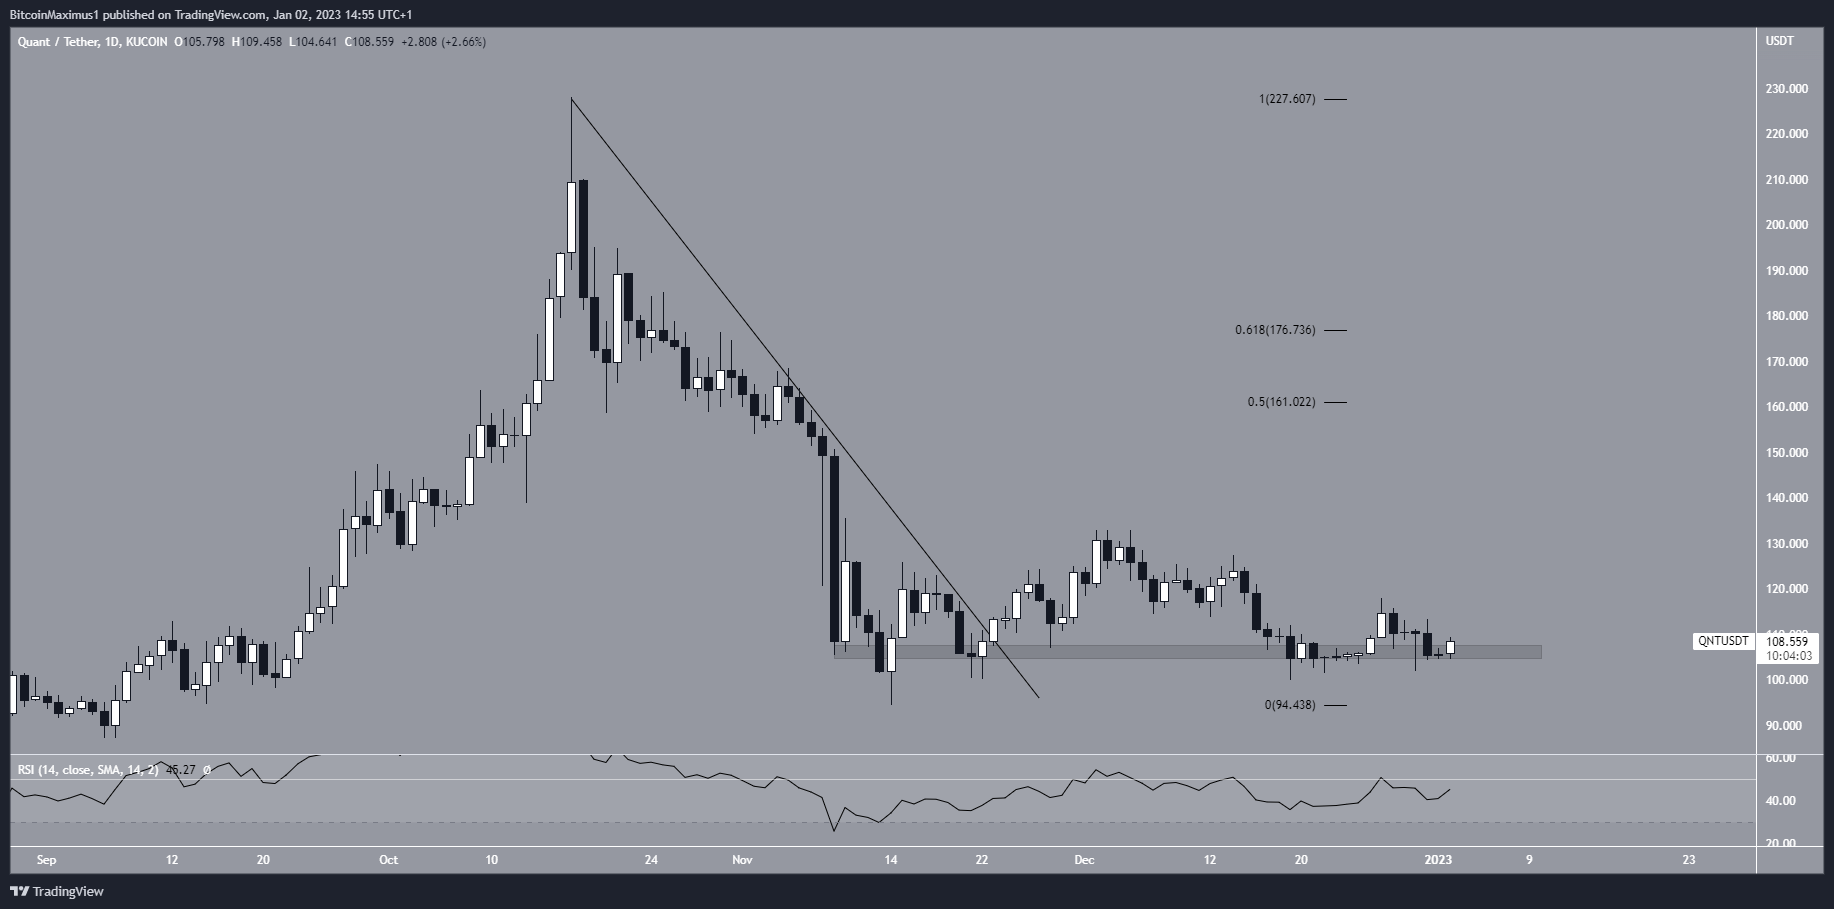
A closer look at the technical analysis in the daily time frame shows that the QNT price also broke out from a short-term descending resistance line. However, it failed to sustain its upward movement. Additionally, there is a minor support level at $105, above which the QNT price is currently trading. While it is possible that the Quant price action created a double bottom, the pattern is not confirmed yet.
Similarly to the weekly time frame, the daily RSI is undecided since it is just below 50 but moving upwards.
If an upward movement were to occur, the main resistance area would be at an average price of $161 – $176, created by the 0.5-0.618 Fib retracement resistance levels.
The wave count supports the possibility of an upward movement. It shows that the Quant price completed a five-wave downward movement before breaking out from the resistance line. If so, it is now completing an A-B-C structure that will take it toward the 0.5-0.618 Fib retracement resistance levels. The fact that the QNT price is trading inside a descending parallel channel supports this possibility.
If the count is correct, it will provide a bullish Quant price prediction for January, indicating that an upward movement toward $161 – $176 is expected. A close below the $105 minor support area would invalidate this bearish price forecast, instead suggesting that a drop to $90 will occur.
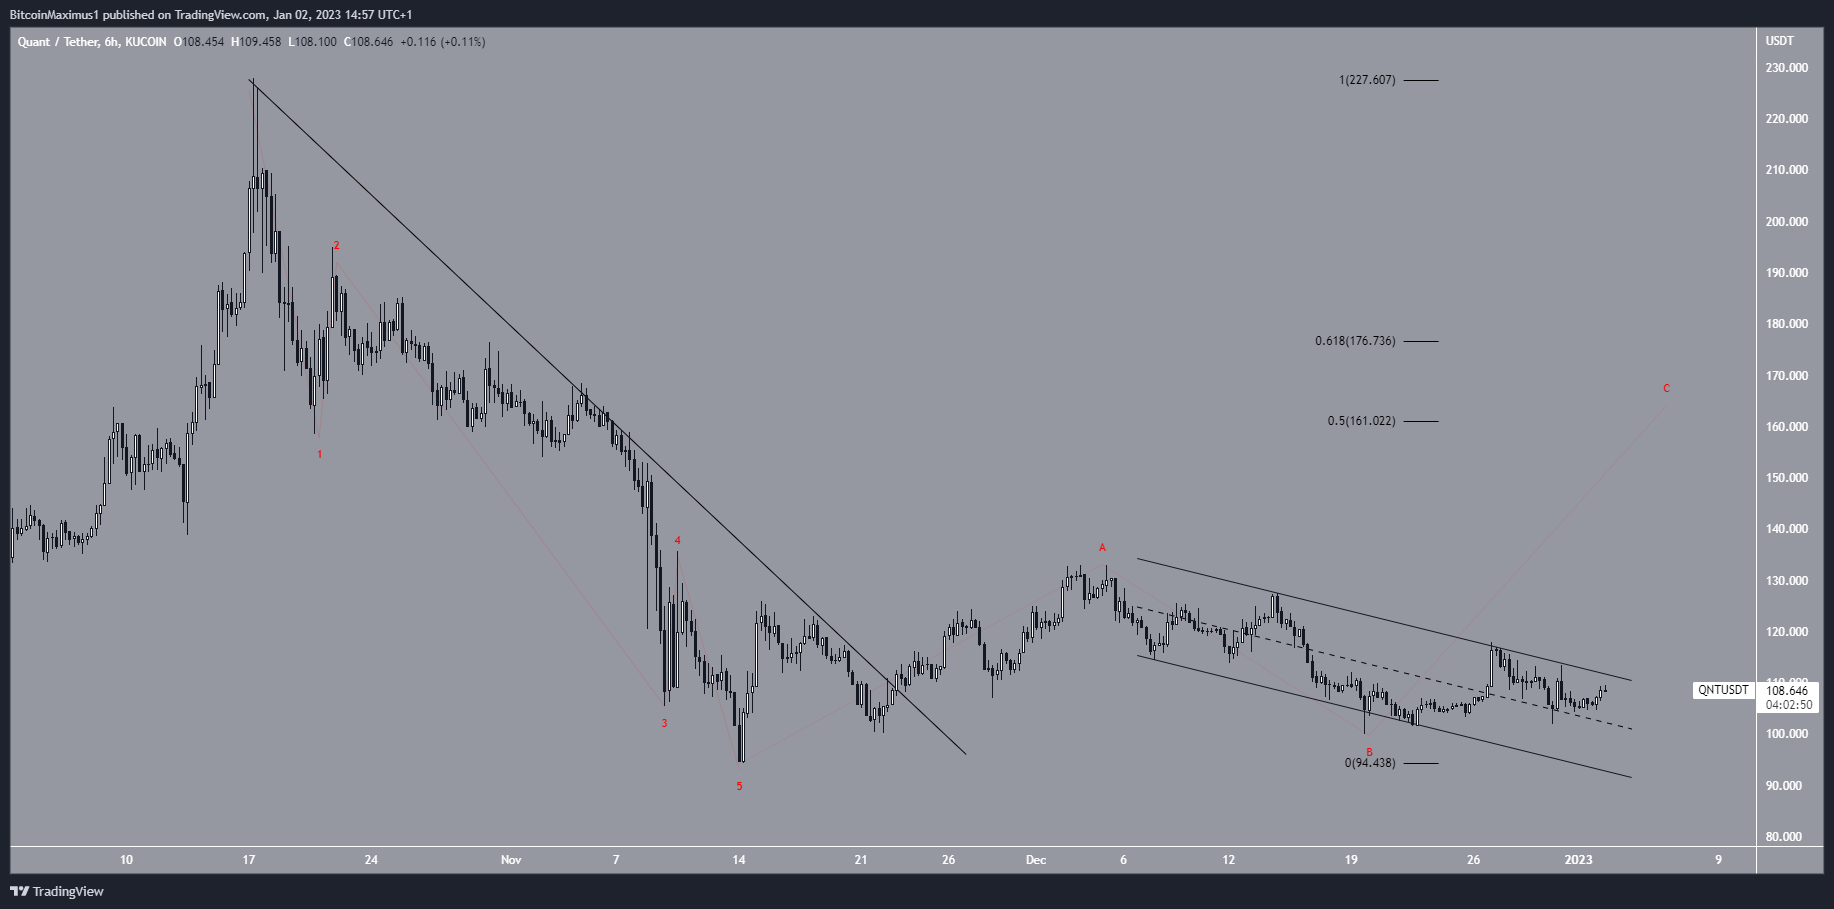
To conclude, there are no decisive bullish nor bearish signs for the QNT price. However, the wave count is leaning bullish, supporting the possibility that a relief rally toward $161 – $176 will transpire. A drop below $105 would invalidate this bullish Quant price analysis and instead suggest that a drop to $90 will occur.
សម្រាប់ការវិភាគទីផ្សារគ្រីបតូចុងក្រោយបង្អស់របស់ BeInCrypto ចុចទីនេះ។
ការមិនទទួលខុសត្រូវ
BeInCrypto ខិតខំផ្តល់ព័ត៌មានត្រឹមត្រូវ និងទាន់សម័យ ប៉ុន្តែវានឹងមិនទទួលខុសត្រូវចំពោះការពិតដែលបាត់ ឬព័ត៌មានមិនត្រឹមត្រូវណាមួយឡើយ។ អ្នកគោរពតាម និងយល់ថាអ្នកគួរតែប្រើព័ត៌មាននេះដោយហានិភ័យផ្ទាល់ខ្លួនរបស់អ្នក។ Cryptocurrencies គឺជាទ្រព្យសកម្មហិរញ្ញវត្ថុដែលមានការប្រែប្រួលខ្លាំង ដូច្នេះត្រូវស្រាវជ្រាវ និងធ្វើការសម្រេចចិត្តផ្នែកហិរញ្ញវត្ថុផ្ទាល់ខ្លួនរបស់អ្នក។
Source: https://beincrypto.com/quant-price-prediction-jan-176-incoming/