និយមន័យ
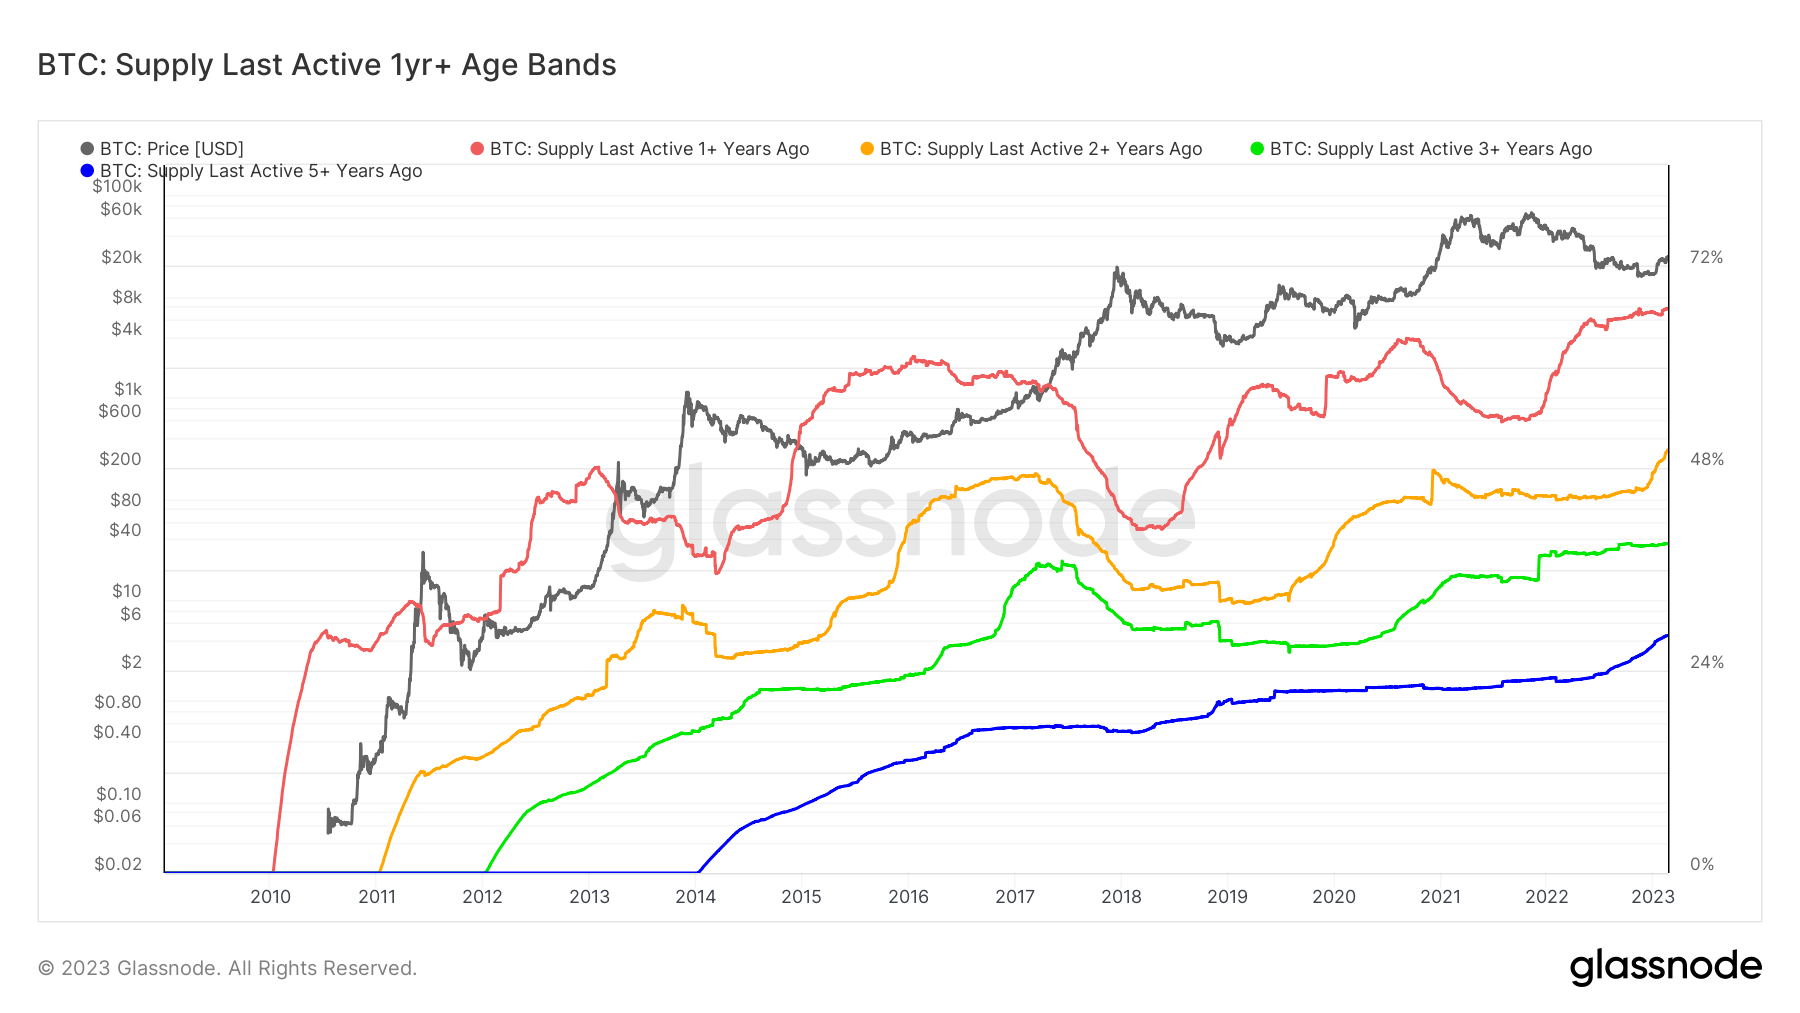
As investors accumulate and store (or lose) coins for longer periods, we can categorize them based on how long it has been since they last moved on-chain.
This chart displays an overlay of multiple Supply Last Active variants, each shown as a percentage of Circulating Supply.
- ការផ្គត់ផ្គង់ចុងក្រោយសកម្ម 1+ ឆ្នាំកន្លងទៅ

- ការផ្គត់ផ្គង់ចុងក្រោយសកម្ម 2+ ឆ្នាំកន្លងទៅ

- ការផ្គត់ផ្គង់ចុងក្រោយសកម្ម 3+ ឆ្នាំកន្លងទៅ

- ការផ្គត់ផ្គង់ចុងក្រោយសកម្ម 5+ ឆ្នាំកន្លងទៅ

As longer-term investors accumulate coins, these metrics will tend to rise. Conversely, as long-term investors spend and distribute their coins, this metric will decline, with older coins becoming young again as they change hands.
យករហ័ស
- Supply’s last active 2+ years ago hit 50% of the circulating supply for the first time.
- This cohort bought Bitcoin during the 2021 bull run, while Bitcoin price was roughly $58,000 two years ago.
- All other categories have also hit all-time highs recently.
Events that have occurred since then
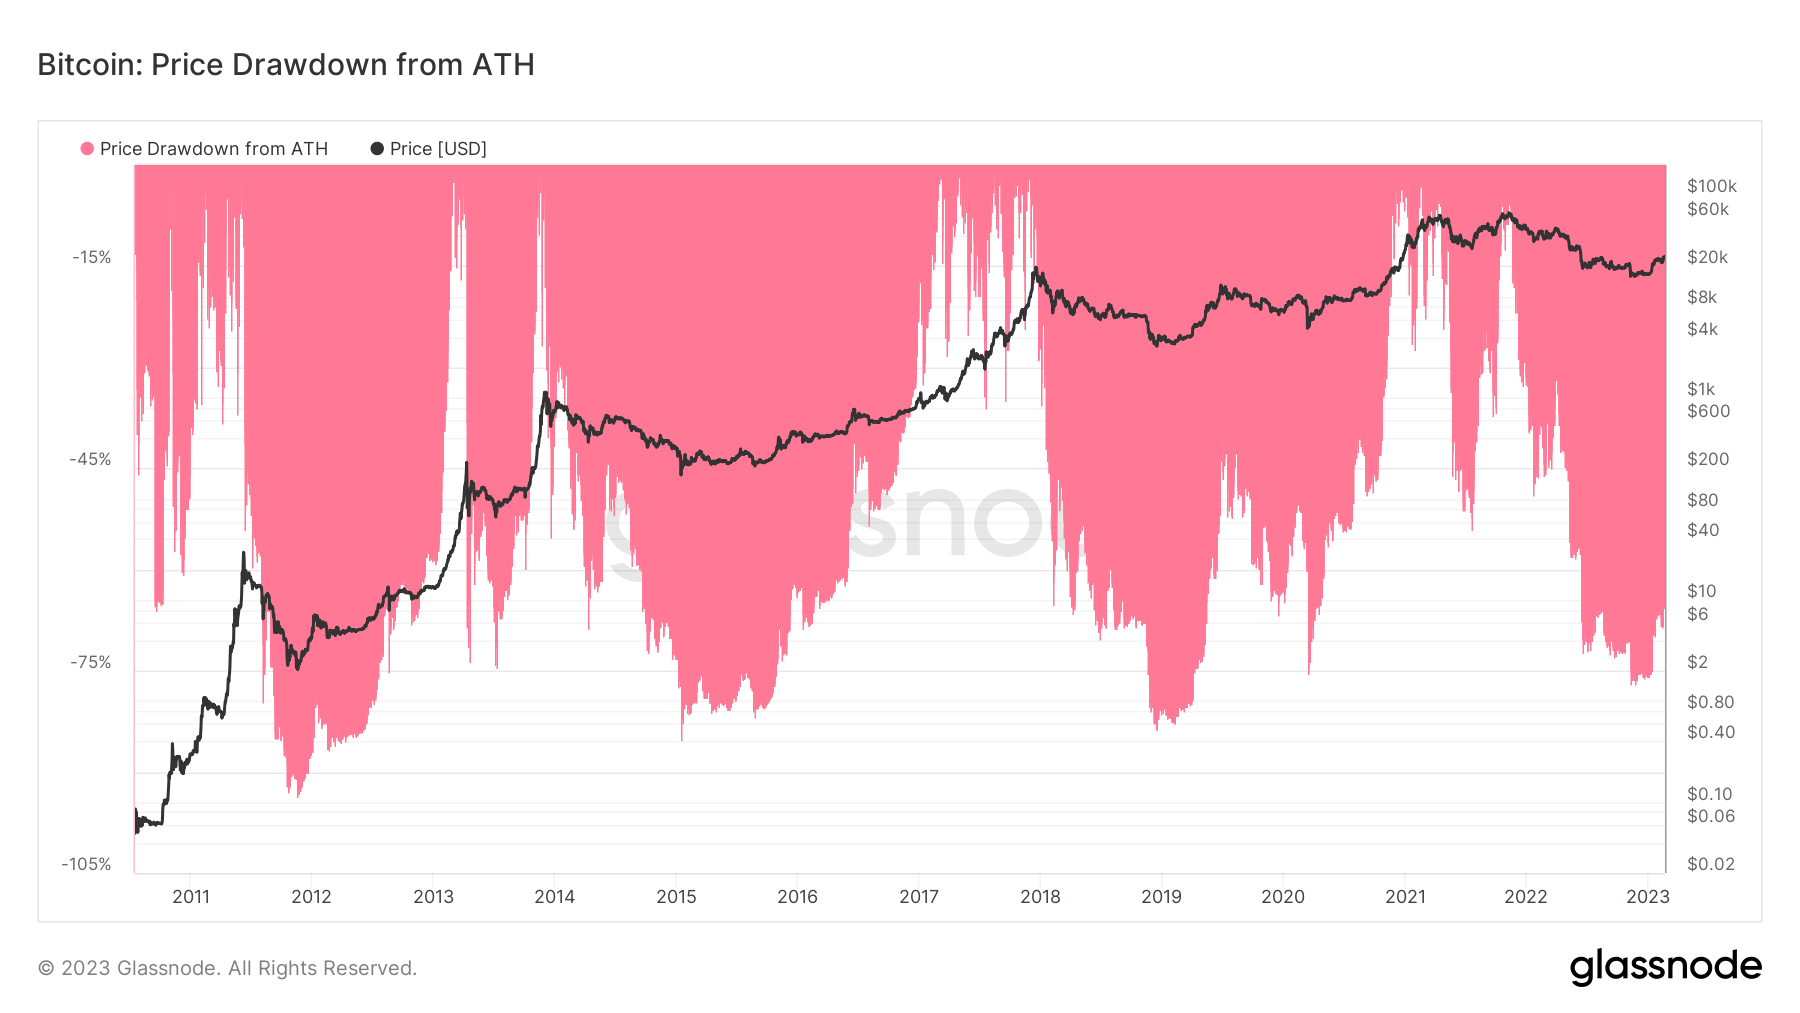
- The price of Bitcoin has dropped 75% from its all-time high.
- Summer of 2021, China banned mining Bitcoin, which subsequently saw the hash rate drop by over 35%.
- The collapse of FTX and Luna and a looming recession on the horizon.
ប្រកាស ការផ្គត់ផ្គង់ចុងក្រោយសកម្មកាលពី 2+ ឆ្នាំមុនបានឈានដល់ជាង 50% នៃការផ្គត់ផ្គង់ដែលកំពុងចរាចរ បានបង្ហាញខ្លួនជាលើកដំបូង CryptoSlate.
Source: https://cryptoslate.com/insights/supply-last-active-2-years-ago-hits-over-50-of-the-circulating-supply/